This report was first issued to schools via the tables checking site in January 2018. The school data used in this document is sample data. The national figures included are the published data which relates to the national data set for academic year 2018-2019. Data has not been published to schools in either academic year 2020 or academic year 2021. No changes as to the way Post 16 data will be assessed moving forward have been published. Schools find it useful to track on this data much of which is available in GO 4 Schools (highlighted in Green throughout this document).
Another performance document we would like to draw your attention to is the 16-18 IDSR (Inspection data summary report). This is the only data document OFSTED uses to assess Post 16 provision. Whilst there is a lot of crossover between the two documents there are significant differences to the way data is displayed. We have produced our own document which looks at how GO 4 Schools can be used in conjunction with the 16-18 IDSR.
Most recent DfE amendments to the sample report
For the 2018/2019 academic year there were minor changes to the 16-18 performance tables. As outlined in the 2019 statement of intent “In 2019, the headline measures for 16 to 18 largely remain unchanged from 2018 apart from the destination measures “.
The new measures include the following changes from the published 2018 performance tables:
- Level 2 vocational cohort withdrawn: from 2019 at level 2 only approved technical certificate qualifications are reported in attainment, completion and attainment, and retention measures.
- Progression to higher education or training: This value-added measure will show the number of level 3 students that progress to a sustained level 4 or higher destination (apprenticeships, level 4/5 courses and degrees).
- Destination measures: The cohort of students in scope for destination measures is expanded to include students of level 2 and below and unapproved qualifications. Students that did not attend their school or college in the year in which they were deemed to have reached the end of 16 to 18 study are also included by implementing a flexible destination year methodology.
Further details and methodology for the measures report also appear in the 16-18 guidelines.
The performance measures report and GO 4 Schools
Since this report was originally published we have developed and updated our post 16 tables, subject pages and explorers to incorporate measures within this report. As said previously, data that is highlighted in green is visible in GO 4 Schools. Not all aspects of the performance measures report appear in this document. For example, we do not have any destinations or retention tables as we do not have access to the school data needed to calculate these measures.
At the time of writing we do not have any Level 2 performance tables for Year 12 or Year 13.
In this document we have added the following for reference:
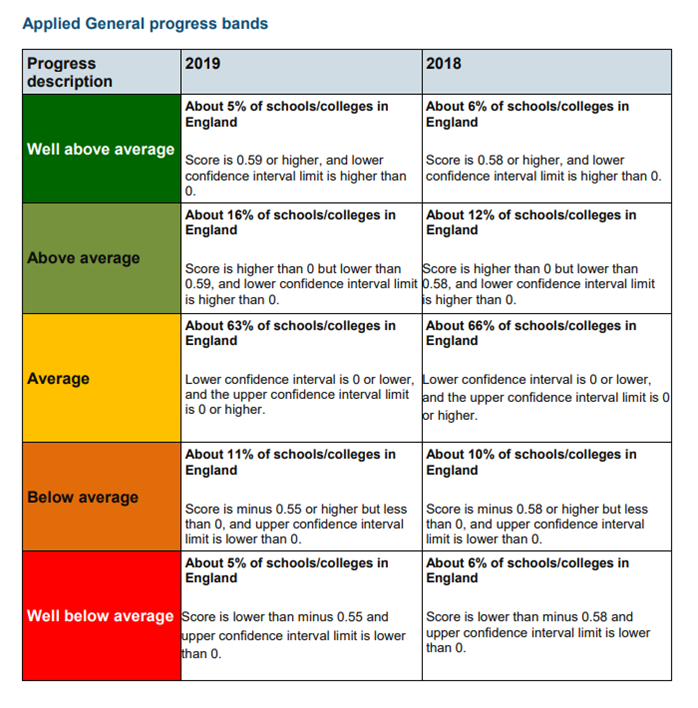
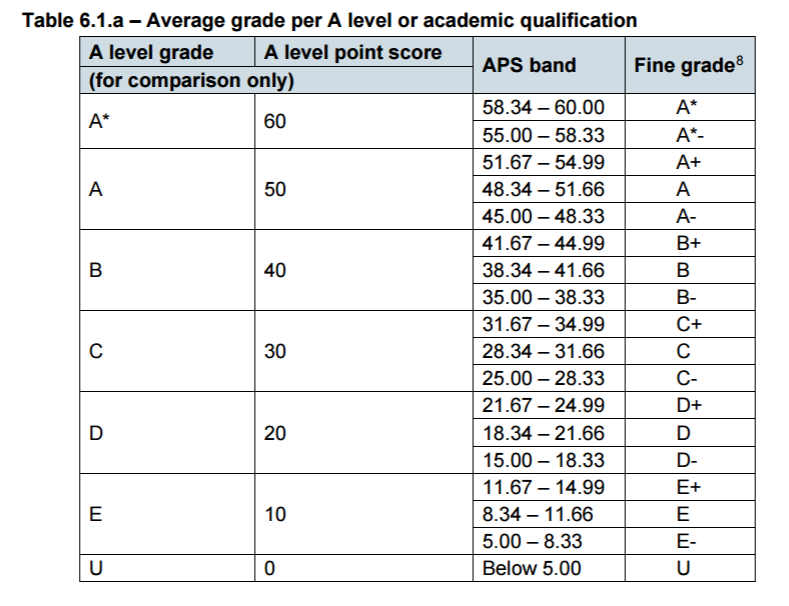
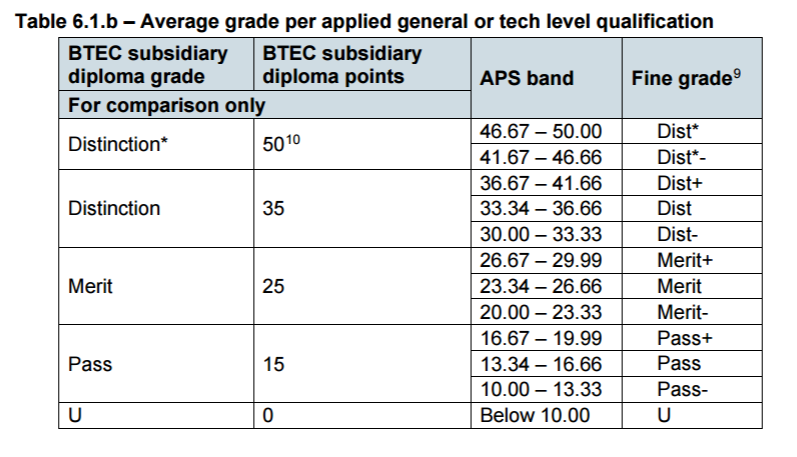
- Tables 6.1a and 6.1b directly from the 16-18 technical guidelines. These illustrate the grade boundaries for APS per entry.
- The banding for Level 3 Value Added (L3VA) judgements appears in Appendix A.
Sample Tables
A level cohort
National (all schools and colleges) average point score per A level entry (expressed as a grade): 34.01 (C+)
National (all state funded schools and colleges) percentage of A level students retained: 91.3%
|
Average point score per A level entry |
28.22 |
|
Average point score per A level entry expressed as a grade |
C- |
|
Number of students at the end of 16-18 study with an A level exam entry (for average grade measure) |
52 |
|
Value added score |
0.02 |
|
Lower confidence limit of value added score |
-0.16 |
|
Upper confidence limit of value added score |
0.33 |
|
Number of A level exam entries (for value added measures) |
142 |
|
Percentage of A level students retained |
96.1% |
|
Percentage of A level students retained and assessed |
94.9% |
|
Number of students at the end of 16-18 study with an A level core aim (for retention and retained and assessed measures) |
49 |
|
Percentage of A level students returned and retained for a second year |
65% |
|
Number of students at the end of 16-18 study with an A level core aim (for returned and retained for a second year measure) |
48 |
L3VA judgement: Average (Band 3 of 5)
Academic cohort
National (all schools and colleges) average point score per academic entry (expressed as a grade): 34.33 (C+)
National (all state funded schools and colleges) percentage of academic students retained: 91.2%
|
Average point score per academic entry |
28.35 |
|
Average point score per academic entry expressed as a grade |
C |
|
Number of students at the end of academic study (for average grade measure) |
52 |
|
Value added score |
0.04 |
|
Lower confidence limit of value added score |
-0.17 |
|
Upper confidence limit of value added score |
0.31 |
|
Number of Academic entries (for value added measures) |
142 |
|
Percentage of academic students retained |
96.1% |
|
Percentage of A level students retained and assessed |
94.9% |
|
Number of students at the end of 16-18 study with an academic core aim (for retention and retained and assessed measures) |
49 |
|
Percentage of academic students returned and retained for a second year |
65% |
|
Number of students at the end of 16-18 study with an academic core aim (for returned and retained for a second year measure) |
48 |
L3VA judgement: Average (Band 3 of 5)
Applied General cohort
National (all schools and colleges) average point score per applied general entry (expressed as a grade): 28.91 (Merit+)
National (all state funded schools and colleges) percentage of applied general students retained: 86.5%
|
Average point score per applied general |
29.97 |
|
Average point score per applied general entry expressed as a grade |
Merit+ |
|
Number of students at the end of applied general study (for average grade measure) |
18 |
|
Value added score |
-0.31 |
|
Lower confidence limit of value added score |
-0.57 |
|
Upper confidence limit of value added score |
-0.05 |
|
Number of applied general entries (for value added measures) |
42 |
|
Percentage of applied general students retained |
100% |
|
Percentage of applied general students retained and assessed |
94.2% |
|
Number of students at the end of 16-18 study with an applied general core aim (for retention and retained and assessed measures) |
18 |
|
Percentage of applied general students returned and retained for a second year |
100% |
|
Number of students at the end of 16-18 study with an applied general core aim (for returned and retained for a second year measure) |
10 |
L3VA judgement: Below average (Band 4 of 5)
Tech level cohort
National (all schools and colleges) average point score per tech level entry (expressed as a grade): 28.64 (Merit+)
National (all state funded schools and colleges) percentage of tech level students retained: 87.9%
|
Average point score per tech level entry |
31.33 |
|
Average point score per tech level entry expressed as a grade |
Dist- |
|
Number of students at the end of tech level study (for average grade measure) |
7 |
|
Completion and attainment score |
0.12 |
|
Number of tech level aims (for completion and attainment measure) |
5 |
|
Percentage of tech level students retained |
100% |
|
Percentage of tech level students retained and assessed |
100% |
|
Number of students at the end of 16-18 study with a tech level core aim (for retention and retained and assessed measures) |
5 |
|
Percentage of tech level students returned and retained for a second year |
100% |
|
Number of students at the end of 16-18 study with a tech level core aim (for returned and retained for a second year measure) |
5 |
In addition to this GO 4 Schools will provide data on the Tech Bacc measure (see below).
There are also tables for the level 2 vocational cohort based on the format of the tech level cohort but with different points applied in accordance with the values outlined in the 16-18 guidelines (from p18 onwards). This changed from academic year 2019 onwards to include only technical certificates.
English and maths
National (all schools and colleges) average progress in English: +0.14 grades
National (all schools and colleges) average progress in maths: +0.09 grades
|
Average progress in English |
0.43 |
|
Number of students in scope for English progress measure |
5 |
|
Average progress in maths |
0.37 |
|
Number of students in scope for maths progress measure |
7 |
Although GO 4 Schools does not directly calculate a progress score for English and maths we have produced a guidance document to support tracking progress of this measure. Click here.
Additional attainment measures
National (all schools and colleges) average point score per entry in best 3 A levels (expressed as a grade): 33.78 (C+)
National (schools and colleges) percentage of students achieving at least AAB at A level in at least 2 facilitating subjects: 19.8%
|
Average point score per entry in best 3 A levels |
29.35 |
|
Average point score per entry in best 3 A levels expressed as a grade |
C |
|
Number of students included in best 3 A levels measure |
39 |
|
Percentage of students achieving at least AAB in facilitating subjects |
14.5% |
|
Number of students in AAB measure |
26 |
|
Number of students achieving the Tech Bacc |
4 |
|
Percentage of students in scope of the level 3 Maths measure achieving level 3 maths |
18.0% |
|
Number of students in the level 3 maths measure |
60 |
|
Percentage of level 2 vocational students that are technical certificate students |
NE |
|
Number of students entering level 2 vocational qualifications (ignoring discounting) |
NE |
Disadvantaged measures (headline measures)
Disadvantaged students are those who were in receipt of pupil premium when they were in the last year of KS4. Their performance in the 16-18 headline measures is compared to non-disadvantaged students in state-funded schools and colleges nationally.
This is not included on the report from the tables checking site when individual school data is published but is good for benchmarking purposes. Blank cells are where data is unavailable.
A level cohort – Disadvantaged (and national non-disadvantaged state-funded comparison)
|
|
Institution Figure |
National State funded figure (non-Disadvantaged) |
Disadvantaged |
|
Average point score per A level entry |
21.35 |
33.58 |
28.70 |
|
Average point score per A level entry expressed as a grade |
D |
C+ |
C |
|
Number of students at the end of 16-18 study with an A level exam entry (for average grade measure) |
9 |
|
|
|
Value added score |
0.03 |
0.00 |
-0.12 |
|
Lower confidence limit of value added score |
-0.15 |
|
|
|
Upper confidence limit of value added score |
0.34 |
|
|
|
Number of A level exam entries (for value added measures) |
26 |
|
|
|
Percentage of A level students retained |
80.0% |
|
|
|
Number of students at the end of 16-18 study with an A level core aim (for retention measure) |
9 |
|
|
L3VA judgement: Average (Band 3 of 5)
Academic cohort – Disadvantaged (and national non-disadvantaged state-funded comparison)
|
|
Institution Figure |
National State funded figure |
Disadvantaged |
|
Average point score per academic entry |
21.42 |
|
|
|
Average point score per academic entry expressed as a grade |
D |
|
|
|
Number of students at the end of academic study (for average grade measure) |
9 |
|
|
|
Value added score |
0.03 |
|
|
|
Lower confidence limit of value added score |
-0.13 |
|
|
|
Upper confidence limit of value added score |
0.35 |
|
|
|
Number of Academic entries (for value added measures) |
30 |
|
|
|
Percentage of academic students retained |
80.0% |
|
|
|
Number of students at the end of 16-18 study with an academic core aim (for retention and retained and assessed measures) |
9 |
|
|
L3VA judgement: Average (Band 3 of 5)
Applied general cohort –Disadvantaged (and national non-disadvantaged state-funded comparison)
|
|
Institution Figure |
National State funded figure |
Disadvantaged |
|
Average point score per applied general |
29.97 |
29.26 |
27.72 |
|
Average point score per applied general entry expressed as a grade |
Merit+ |
Merit+ |
Merit+ |
|
Number of students at the end of applied general study (for average grade measure) |
2 |
51573 |
15405 |
|
Value added score |
-0.77 |
0.02 |
-0.04 |
|
Lower confidence limit of value added score |
-0.93 |
|
|
|
Upper confidence limit of value added score |
-0.43 |
|
|
|
Number of applied general entries (for value added measures) |
4 |
|
|
|
Percentage of applied general students retained |
100% |
|
|
|
Number of students at the end of 16-18 study with an applied general core aim (for retention and retained and assessed measures) |
2 |
|
|
L3VA judgement: Well below average (Band 5 of 5)
Tech level cohort – Disadvantaged (and national non-disadvantaged state-funded comparison)
|
|
Institution Figure |
National State funded figure |
Disadvantaged |
|
Average point score per tech level entry |
40.00 |
29.20 |
26.80 |
|
Average point score per tech level entry expressed as a grade |
Dist+ |
Merit+ |
Merit+ |
|
Number of students at the end of tech level study (for average grade measure) |
1 |
14,612 |
4,615 |
|
Completion and attainment score |
1.00 |
|
|
|
Number of tech level aims (for completion and attainment measure) |
1 |
|
|
|
Percentage of tech level students retained |
100 |
|
|
|
Number of students at the end of 16-18 study with a tech level core aim (for retention measure) |
1 |
|
|
As with the general tables there are also tables for the level 2 vocational cohort based on the format of the tech level cohort but with different points applied in accordance with the values outlined in the 16-18 guidelines (from p18 onwards). This changed for academic year 2019 to include only technical certificates.
English and Maths – Disadvantaged (and national non-disadvantaged state-funded comparison)
|
|
Institution figure |
National State funded figure |
Disadvantaged |
|
Average progress in English |
1.00 |
0.25 |
-0.03 |
|
Number of students in scope for English progress measure |
1 |
|
|
|
Average progress in maths |
-0.5 |
0.17 |
-0.04 |
|
Number of students in scope for maths progress measure |
2 |
|
|
Although GO 4 Schools does not directly calculate a progress score for English and maths we have produced a guidance document to support tracking progress of this measure. To access the document click here.
Appendix A – Level 3 value added minimum standards and banding
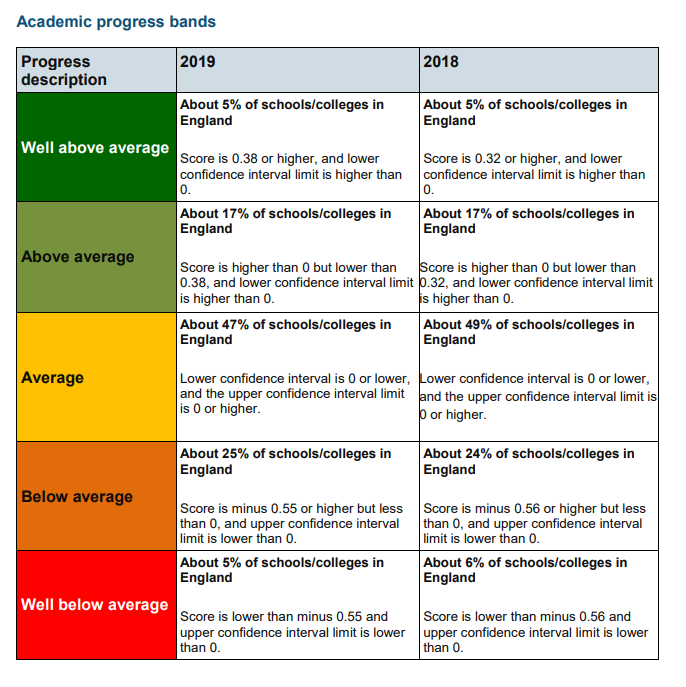
New banding criteria for the Level 3 value added measure was released in January 2020 and has not been updated since.
Details of the bandings are shown below and can be found at Progress scores for 16 to 18
Banding for the A level cohort
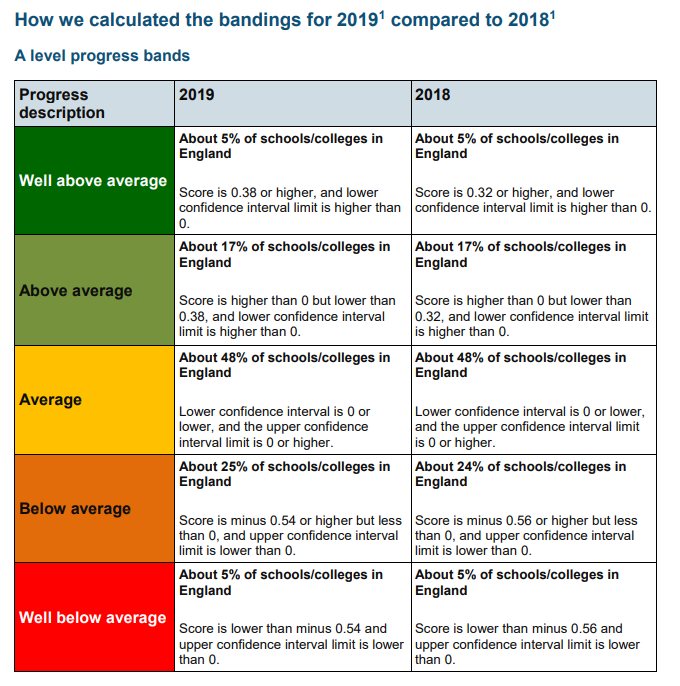
Banding for the academic level cohort
Banding for the applied general/tech level cohort