
This guidance document is intended to support school and subject leaders with the analysis of the KS4 curriculum results using GO 4 Schools. It outlines where subject level information can be viewed, compared and how to drill down into key focus group analysis at a wider curriculum and subject level. Data can be compared with national subject examination results published for the examination year from JCQ or by using OFQUAL Analytics.
This guidance document will focus on comparative subject analysis across the school for a forensic view of school performance to validate curriculum decisions. This can be used alongside the performance measures statistics tables in GO 4 Schools for core subjects or subjects that contribute to the EBacc performance measure. Referring to the headline measures table available on the Year 11 home page and the detailed statistics page you may also find it useful to read the ‘Analysing KS4 headline measures guidance’ document.
Effective subject level analysis is crucial to driving successful school improvement. Each subject has the potential to positively influence student outcomes and therefore contribute to the success of the overall performance of the school.
National Focus Groups/Areas to Investigate from Inspection Data Summary Report (IDSR)
The following key student focus groups have been identified as areas to investigate levels of achievement during inspection. They may appear as priorities in your IDSR or within Analyse School Performance (ASP) and may be identified as lines of enquiry during an inspection.
- Prior attainment groups based on KS2 outcomes
- Disadvantaged students compared to their peers nationally and against non-disadvantaged student locally.
- Students with SEND
More specific focus group identified nationally as underperforming may include:
- Higher prior attaining, disadvantaged (White British boys)
- SEND by prior attainment – all coded groups (EHCP – E, SEND support – K, Statement – S vs non-SEND)
- Outliers – positive and negative
- ESOL entry – for non-English speakers
- Subject – Entry vs attainment based on the coverage of 17 subject clusters – from IDSR.
Whilst these groups have been identified as priorities based upon national data, you may have different focus groups that have been identified from your school level data. By setting up attributes to cover these national focus groups and your school level focus groups, you will ensure that you are able to interrogate your data at any point in the year for these priority students, enabling early support to be provided to ensure any gaps that exist can be reduced or closed so that every student achieves their target grade.
School managers can create attributes in GO 4 Schools. Should you require additional attributes to support your analysis you should discuss this with your line manager or GO 4 Schools lead person.
One of the simplest ways to review the achievement of focus groups is by using the new enhanced residual ribbons. These are available to view at Year group level and subject level. Subject specific analysis information can be understood by reading the ‘KS4 Subject results analysis guidance’ document.
Subject comparative data
Schools need to compare performance across the curriculum to see where student performance has excelled or has been challenged. Key issues such as the type of student cohort, subject area teaching shortages, resources, allocated curriculum time can all impact on individual subject outcomes. Viewing all subjects together is an important aspect of analysis for all school leaders.
The analysis tools described can be used for in year tracking using your preferred progress grade. For exam results analysis, we recommend that you change the preferred progress grade to the ‘Actual grade’ in Grade settings once examination grades are uploaded.
Detailed statistics
From the Year group page select  to navigate to the ‘Detailed statistics’ page.
This page will show the key stats table including all the current performance measures. Below this table the ‘Pass rates by subject’ and the ‘Average numeric points per subject’ tables can be viewed.
Pass rates by subject
This table displays the pass rates as a percentage based on the selected grade thresholds across all subjects for each of the visible grade types. The cumulative grade thresholds are 1+, 4+, 5+, 7+. Individual or multiple tables can be viewed on the page. The key tracking grades are highlighted, as shown below the Target and Current grade. For exam analysis, set the actual grade as the preferred progress grade.
The table is showing all subjects listed by department by grade types so these can be easily compared.
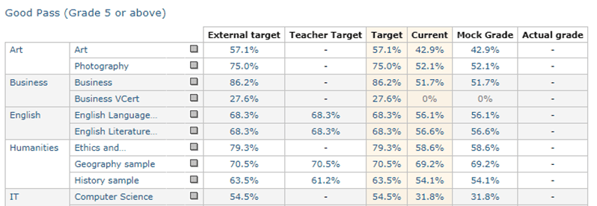
The data within the table can be selected to show student level information for those who have achieved the threshold and those students who have not achieved the threshold.
Grading schemes that do not use numeric grades and formal QANs will be shown separately. GCSE and equivalences will all display in the main table.
The curriculum overview page will show the same data as above but allow you to select by any grade and has the option to add snapshot data side by side for ease of comparison. See the related article. Curriculum overview
Average numeric points per subject
The table for numeric points repeats the display of all subjects by department using the formal numeric points for the qualification.
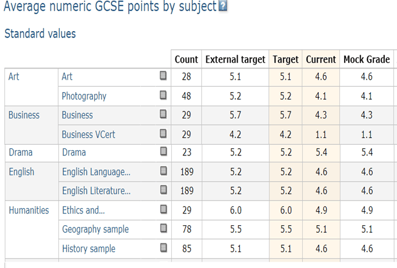
This table allows for analysis of the difference from target to progress by points. In the example shown Business VCert has a 3.1 numeric points difference (3 grades) but this is probably due to incomplete units. Ethics however has a 1.1pts difference (1 grade) and you may expect students to be closer to target based on live assessments.

The data in these tables can be changed to show different ‘snapshots’ of the grades taken at various points in the academic year. By selecting the link a pop-up menu will display the options for the dates available from the prepared reports.
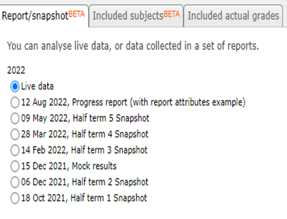
The grades included in your snapshot will update in the table so differences in the percentages or average numeric points can be viewed.
The Curriculum overview page also has tables for average numeric points which allows you to add snapshot data and filter by subjects and key focus groups. See the related article.
Enhanced ribbons
On the Year group and subject pages, you will find enhanced ribbons for comparing subject performance and individual detailed subject performance respectively. The ribbons are grouped by two main types of data; school residual schemes or by grade/points distributions.
Key features of the ribbons are options to:
- filter subjects in the display to remove non-curricular and non-exam-based subjects for the year group
- view residual ribbons by residual scheme or department for the year group
- view grade distribution ribbons by qualification type or department for the year group
- select any target or progress grade as a residual display
- select distribution by grades – whole and fine or points
- filter ribbon selections by key focus groups
- View student level data interactively for each ribbon band
- View ribbon data in table form as counts, percentages, and cumulative data
- Download data tables as a csv.
The ribbons must be enabled by the school manager to be visible to users. Either school managers only, with curriculum leaders or all staff. This setting is in Curriculum > Statistics and analysis settings.
Year group enhanced ribbons
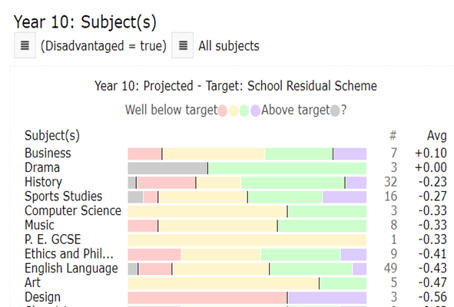
On the year group page, you will find the enhanced ribbons which support a rich forensic analysis of the curriculum through their full interactivity and use of your live assessment data.
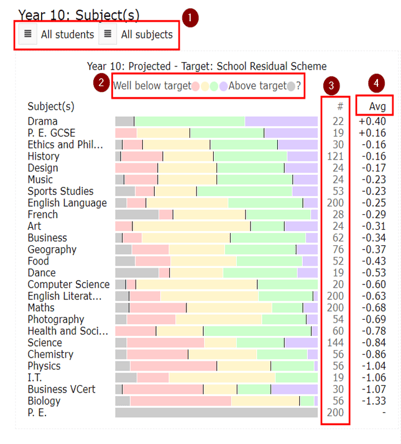
The default will display your residual ribbons based on your preferred target and progress grades.
- Filtering options for Students and All subjects.
- The ribbons will display your default residual scheme, any subject specific residuals will display separately.
- Count of students in each subject.
- Average residual difference comparing target to progress based on the residual scheme. In this view subjects are ordered by descending residual values.
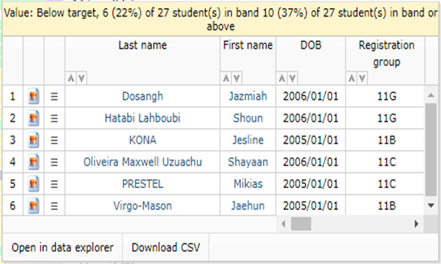
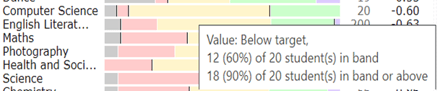
The ribbons are fully interactive, and each section can be hovered over to view tool tips for each individual ribbon band: here showing the number of student in each band and cumulatively. This allows for a quick comparisons to be made.
Clicking on a section of the ribbon shows a pop up listing the students in the band with the key details. From here these students can be downloaded as a .csv, opened in a data explorer to add in additional data or clicked on an individual student to go to their student page.
Adding ribbons
You can add additional residual or distribution ribbons to the default set and select your preferred display by using the ribbon menu bar:

When adding ribbons this will add an additional column to the default set.
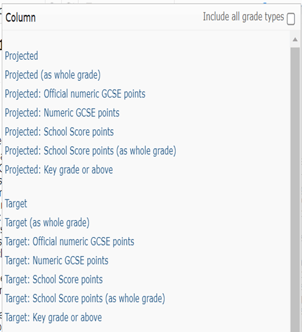
You can select from each enabled grade type and different progress grade and target grade comparisons using the school residual schemes applied. Your main target and progress grade will be prioritised in the list, but by selecting ‘Include all grade types’, additional grade sets will be added to the selection.
For each grade a range of options is available for fine or whole grades and various points options (numeric, school score etc). The ribbons will be ordered highest to lowest based on the value selected.
It is important to think about the format of the data when selecting the ribbons’ values, as some selections will show a huge range of values that will be difficult to review e.g., current grade numeric points will find individual points values per student for each subject. You may wish to consider using the csv download when using such a wide spread of values in the data.
Once you have selected the additional ribbons you can use the menu to change the display layout.
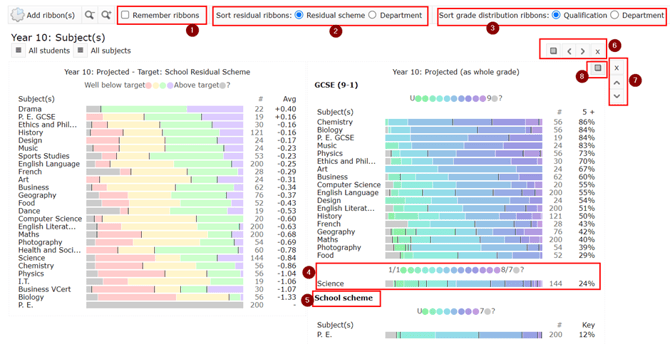
- Remember ribbons allows the user to retain their selection of ribbons on their device using cookies. These will be removed if the cookies are cleared.
- The default residual ribbons display based on residual schemes is in use, this can be changed to display the ribbons grouped by department.
- The grade distribution ribbons will by default display based on qualification types in use, the example is showing all GCSE qualifications as a group of ribbons. This can also be changed to view subjects by department.
- The GCSE combined science is split from the main set of ribbons due to the double grade scheme in use.
- Other qualifications in use will be shown separately in the display i.e., BTECs and School schemes as shown.
- The display allows the ribbon columns to be reordered left to right or removed.
- The side display menu will move the ribbon rows up or down.
- The icon will display the table view.
These display options become very useful when viewing the data as tables.
Viewing data tables
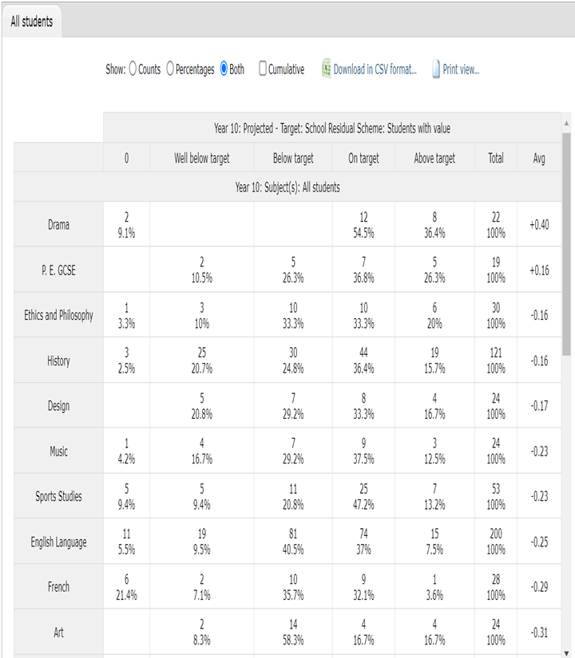
For each ribbon set or column view the icon can be used to view the data in a table format.
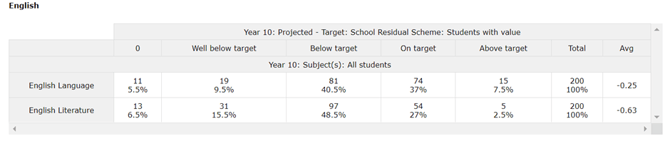
The table data remains in the same order as the data in the ribbon view. The data remains interactive, and each cell can be clicked on to view the names of the students.
The table has options to view counts, percentages or both as a distribution or as cumulative data.
The data in the table can be downloaded or printed from your browser.
When set to department the ribbons and tables will display the data accordingly. This may be a preferred option when reviewing the data with subject leaders or using one of the outputs.
Filtering ribbons
You can use the filters on each row of ribbons to filter the data:
Filters by subject
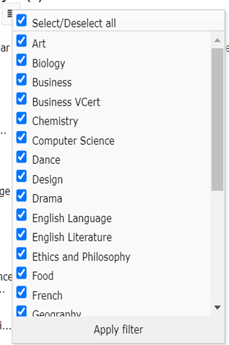
It is important that you use the subject filter to remove any subjects that are non-curriculum so a comparison can be made of subject performance in the taught curriculum. The filter will remove these subjects. By default, all subjects will display the residual ribbons based on your school residual schemes. If different residual schemes are applied to subjects, they will be split out of the table, so you are comparing like for like.
Click on the subject menu filter at the top of the enhanced ribbons and deselect the subjects you wish to remove from the ribbons view.
Filter by student
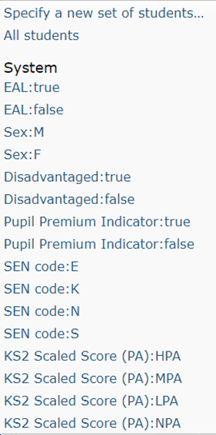
When selecting the student filter, you can define a set of students or select from the list of attributes used for analysis. Filtering will add a new row of ribbons to your selection.
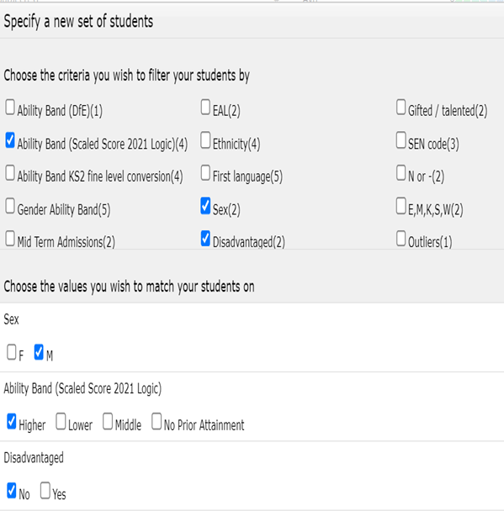
Specifying a new set of students will bring up a popup to allow multiple filters to be applied to the ribbons. For each focus group you will need to select the group to include in the filter as below:
The ribbons will display the selected filter and each time a filter is applied this will add a new set of ribbons as a new row display.
The data tables will display in the same order as the ribbons.
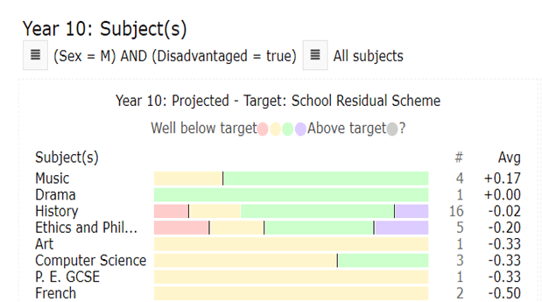
Note, when adding a row of additional filters, the table view will become a long scrollable list so consider the key groups views you require and work with these sets of data using the interactive tools to maximise the benefit of using the year group ribbons.
Year group Data Explorers
When comparing subject performance at student level this is best done by using the Year group explorers. These contain the overview data of entries, points scores and aggregated grades as well as the performance measures data for Progress 8 and EBacc. All subject level data can be found from the Department > Subject nodes which contain a large range of formats to view the grade data captured in GO 4 Schools. More details in the use and functions available in the data explorers can be found in the ‘School managers guide’.
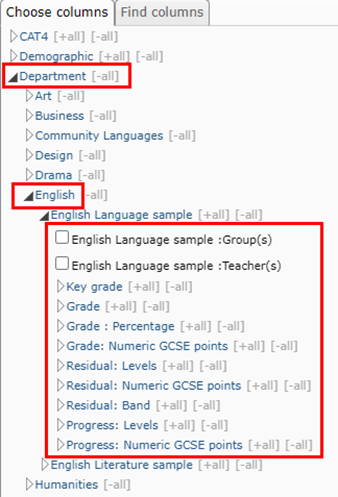
Available nodes for each subject under Department > ‘Subject name’ include:
- grades, grade percentage, grade points for all grade types in use.
- Residual band, points, levels comparing any progress grade to any target grade in use.
- Progress levels and points; if you have a baseline data uploaded.
Within each of the nodes are selections for all grade types in use.
Below shows the data explorer view sorted by number of entries and displaying the current grade and residual label for English Language and literature.

This view can be set up, saved and shared with other staff to include all subjects and will update as your live data changes.
Data for multiple subjects for different ‘snapshots’ throughout the year can also be compared by using the Reports and snapshots node:
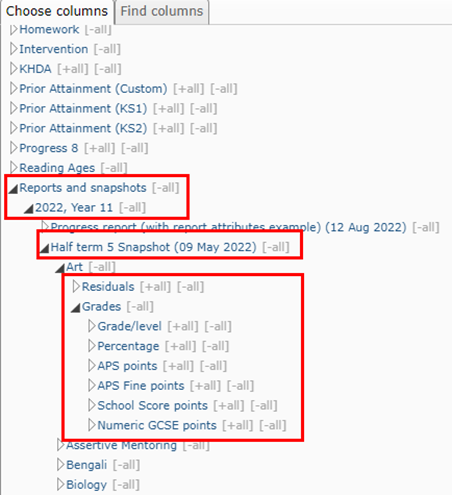
Data can be viewed from any academic year and is then listed chronologically by each of the prepared reports.
Grade or residual data can be selected for each subject included in the snapshot at the time and the data can be selected as grades, percentages and/or points.
The example below comparing maths to English language by grades over time:

If you select numeric points for each of the snapshots, then the data explorer will display totals and averages at the top of the columns so average numeric points over time can also be compared across subjects.

Useful curriculum analysis questions
Examples shown are for KS4 but the same approach can be used for any key stage.
| What are the strongest and weakest performing subject areas? GO TO: Year group > Ribbons > Residual: current vs target – filter by key curriculum subjects. The ribbons default will display the subject by descending residual values.
|
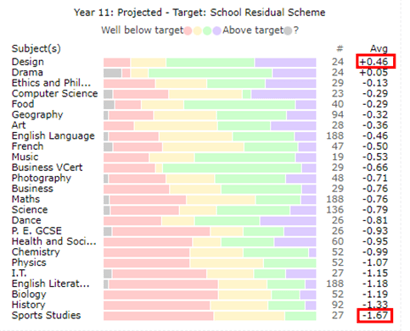 This can be compared by highest and lowest residual when comparing actual grades to target. In the example Design +0.46 is the strongest and Sports Studies -1.67 is the weakest and is more than a whole grade per student lower. Reviewing the residual order shows most subjects are below target as showing a negative residual with only Design and Drama achieving better. The number of students well below target shown by the red lines in the ribbons may require closer inspection. Biology, History and Sports studies have 50%+ of students well below target. Hover over the ribbons or click to view the tooltip or select the table view to see the detailed counts and percentages within the ribbons.
|
| What subjects are contributing to the headline measures? GO TO: Year group > Ribbons > Add ribbons > Grade: official numeric GCSE points. The ribbons default will display the subjects by descending average numeric GCSE points.
|
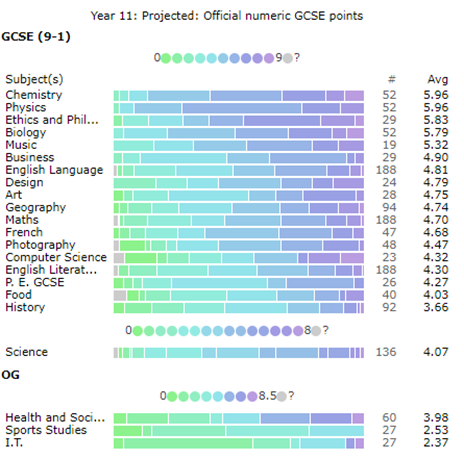 Chemistry, Physics, E&P, Biology and Music all contributed over 5 numeric points on average to school performance measures. If you also compared to target numeric points in another ribbons set, these subjects also had the highest target points values, so potentially a higher attaining cohort of students? Subjects contributing to the EBACC APS can be filtered to view numeric points averages.
|
| What is the performance at grade 5+, 7+ across subjects? GO TO: Year group > Ribbons > Add ribbons > Grade (whole grade). The ribbons will default to display in descending order by percentage of students achieving grade 5+. GO TO: to select pop-out view > Table tab > Show: Both (counts & percentages) + cumulative.
|
| Using cumulative view, review percentage of students at grade 5+ and 7+ (use counts to check numbers for small cohorts of students. In the example Physics has 92%, Chemistry 86% at grade 5+, but Chemistry has 32% at 7+ with more students achieving higher grades and the cohort of students on the single pathway for Science would be comparable. 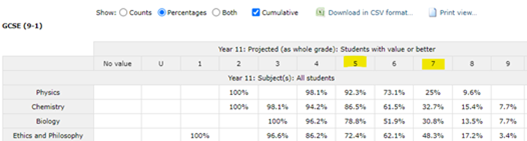 For subjects achieving lower cumulative grade values consideration needs to be given to the ability range of the students within the subject.
|
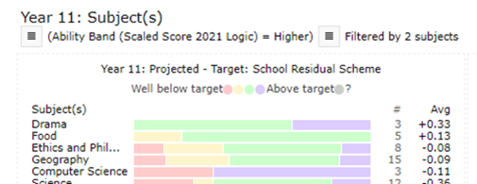
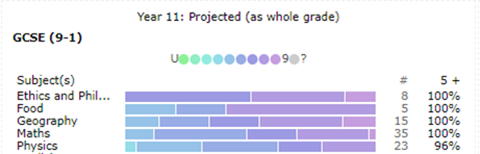
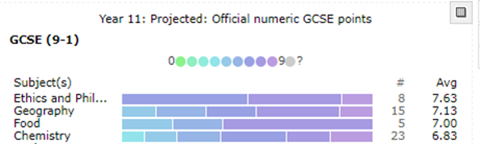
| How have higher prior attaining students performed across the curriculum? GO TO: Year group > Ribbons > filter by ability band (scaled score) = HPA. GO TO: Add ribbons > Grade (whole grade) GO TO: Add ribbons > Grade : official numeric points
|
|
The subject order in the residual ribbons differs for HPA students, caution is required as the count of students needs to be checked i.e., Drama only has 3 HPA students.
Using official numeric points check the subjects with an average numeric point score above 7.0. This can be clarified on the table cumulative data view: E&P has 100% of students at grade 7+.
|
| How did Low Prior attaining students perform? GO TO: Year group > Ribbons > filter by ability band (scaled scores) LPA GO TO: Year group > Ribbons > Grade: official numeric points = LPA or GO to: Year group > Ribbons > Grade: official numeric points = SEN
|
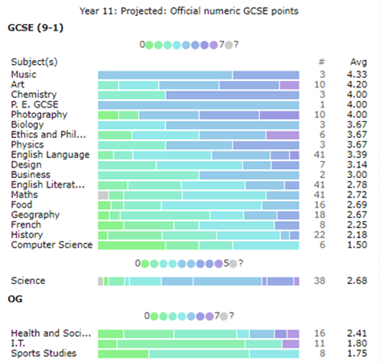
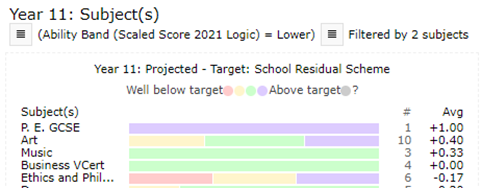 Check the student counts in each subject. The example shows 4 subject areas with LPA students achieving better than the target with a positive average residual. Are the targets challenging in these subjects? The ribbons also display the students achieving their target.
As expected, numeric points distribution shows a range from 4.33 descending to 1.5. The numeric points scores in English and Maths below 3.0 would be a concern with the size of the LPA cohort. Also, a possible concern is the lower numeric points achieved in some of the non-GCSE subjects that may be in the curriculum model as choices for LPA students. Compare the LPA to the SEN groups to see if EHCP students performed as expected. Evidence of effective additional support and teacher strategies for SEN students can be viewed across the curriculum and compared to your typical TA support allocation. |
| What does the total grade distribution look like across all subjects? GO TO: Year group > Ribbons > Grade (whole) – filter by key curriculum subjects for a count of grades for all exam subjects. View table view > select counts > download CSV. |
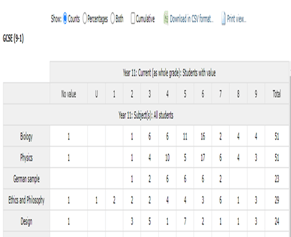 Calculate the totals for each grade. Divide the total for each grade by the total student count and format as a percentage. 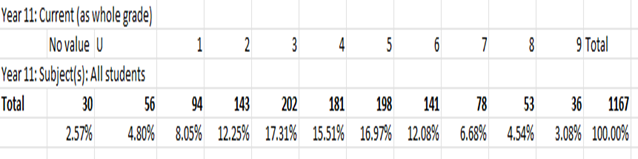 Hide the rows for each subject to display a table showing the percentage of all grades for the year group across your curriculum. This is useful to compare to target, current, projections and actual grades to see differences in where the students are. This data can also be compared to the OFQUAL national data.
|
| Do you have any ‘outliers’ that show very positive or negative progress? Have you created an ‘outliers’ attribute and analysed the impact of those students on headline measures? GO TO: Year group > Ribbons > Residual > Add ribbons > Grade : Numeric points > filter by All students – specify a new set of students > Outliers Below the main ribbon set will display a new row of ribbons showing only the data for the selected focus group. |
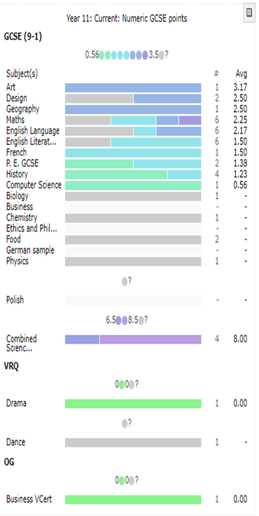 The residual ribbons for Outliers will usually show red across all subjects as these students are performing well below expectations usually due to a range of reasons, but their attainment has a significant impact on the school’s overall performance. The Numeric points ribbons show the average points across the curriculum allowing you to understand the greatest impact of these students. The student count will reflect the number of outlying students affecting each subject. Clicking on each ribbon section allows you to quickly see the student level data to make comparisons. |
Following some of this analysis some wider questions can be asked about the school’s curriculum approach.
Curriculum design and delivery for the future
- What impact has your curriculum model had on subject performance?
- What refinements do you have planned to enhance your curriculum offer for future KS4 students?
- Does your curriculum have both breadth and depth across the ability ranges of your students and does this reflect positively in student outcomes?
Useful links and Supplementary Guidance
- Education Endowment Foundation – Teaching and Learning Toolkit https://educationendowmentfoundation.org.uk/evidence-summaries/teaching-learning-toolkit#closeSignup
- Education Endowment Foundation – Practical Tools https://educationendowmentfoundation.org.uk/tools/
- Using Ofsted’s IDSR guide: https://www.gov.uk/guidance/school-inspection-data-summary-report-idsr-guide#ofsted-idsr-2022
- Ofsted – School Inspection Handbook to be used from September 2022 https://www.gov.uk/government/publications/school-inspection-handbook-eif/schools-inspection-handbook-for-september-2022
- School accountability 2022 - https://www.gov.uk/government/publications/school-and-college-accountability-approach-2020-to-2022
- OFQUAL analytics : GCSE Outcomes https://www.gov.uk/government/publications/school-and-college-accountability-approach-2020-to-2022
- Infograph 2021 results: https://www.gov.uk/government/publications/infographic-gcse-results-2021/infographics-for-gcse-results-2021
- JCQ 2018 Examination Results Publications – Subject Breakdowns https://www.jcq.org.uk/examination-results/