Average point score (APS) per entry is part of the DfE Key Performance Indicators for the Post 16 Accountability measures for Year 13 (and Year 14 if previously not included in Year 13 cohort statistics).
The published data for AY 2024 will include APS points per entry at school and national level.
Although no significant changes have been outlined for reporting. Qualifications achieved in AY 2022 will contribute in line with the methodology highlighted in the DfE 16-18 accountability measures technical guidance which were updated in February 2024.
The DfE calculates APS per entry for the following cohort types:
- A level (which includes AS levels at a value of 0.5 if no corresponding A2 level taken).
- Academic (which includes everything in the A level cohort plus other academic courses, the most common being the extended project qualification [EPQ] and core maths).
- Applied general which includes BTECs, OCR Nationals and other vocational qualifications. A full list of qualifications for this cohort can be found here.
- Tech level cohort Tech levels are level 3 (advanced) qualifications for students wishing to specialise in a technical occupation or occupational group. They lead to recognised occupations, for example in engineering, IT, accounting or professional cookery. Courses that are tech levels can be found here.
- Level 2 Technical Certificate These include all level 2 vocational qualifications of size equivalent to at least two GCSEs (minimum 145 guided learning hours). Courses that counted in this measure for AY 2022 can be found here.
A Level, Academic, Applied General and Tech Level APS points per entry are displayed in GO 4 Schools. As of August 2024, we do not currently display Level 2 Technical Certificate cohort APS points per entry.
GO 4 Schools provides a way of tracking these key statistics throughout the year using your target and progress data, as well as presenting this group of statistics when exam results are issued.
Both A Level APS per entry, Best 3 A levels APS per entry and Applied General APS per entry are also reported on in the 16-19 Inspection data summary report (IDSR) that was last updated in May 2024.
How is APS per entry calculated?
APS per entry is calculated using the points and criteria from the February Key Stage 16-18 Accountability Measures (ref p25).
For the applied general cohort, APS per entry is calculated by dividing the total number of points by the total size of all the entries. The score displayed in GO 4 Schools is also displayed as a grade using the table below.
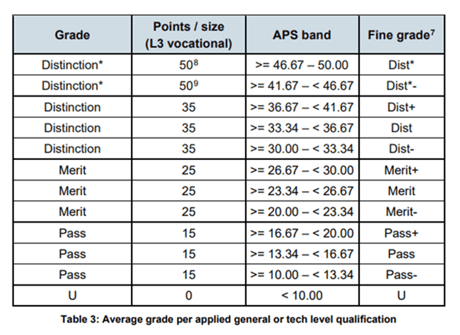
For the A level and academic cohort, the calculation is similar, however it needs to be adjusted to take into account any students who were awarded a U at A Level, who have valid points from that subject at AS level.
“Where a student has attempted an A level and failed (a U grade awarded), but they have been awarded an AS in the same subject, the size of the A level entry is counted and not the size of the AS level entry. Therefore, these students will have an A level size of 1 and not 0.5”.
Example:
Student 1 Size Grade APS
A Level history 1 C 30
A level geography 1 D 20
AS government politics 0.5 C 15
As student 1 has not been entered for the A2 in government and politics this student’s APS points score per A level entry is 26.0 (total number of points divided by 2.5 entries)
Student 2 Size Grade APS
A level history 1 C 30
A level sociology 1 D 20
AS government and politics 0.5 C 15
A2 government and politics 1 U 0
As student 2 has been entered for the A2 in government and politics this student’s APS points score per A level entry is 21.67 (total number of points divided by 3.0 entries).
NB:- The performance points for qualifications spreadsheet details the points scores for all course types. It also shows you all the course sizes. It is worth familiarising yourself with the points and sizes of courses if you do not already know them as this will aid your understanding of the APS per entry statistic.
In addition to the APS points per entry statistics schools will have a best 3 A levels score, which is similar to the APS points per entry for A level. We have produced a separate document for this statistic which can be found here.
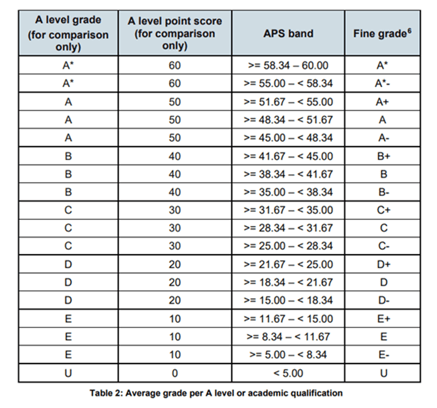
The DfE tables will also display a grade associated with the average APS per entry for the A level cohort. The grade will be taken from a look up table which is on page 26 of the guidelines (see below). This grade is also displayed in GO 4 Schools.
In the 2023 national performance tables the average APS per entry for the A Level cohort was 35.29 points and this was in the band of 35.00-38.34, which is an average grade of a B-. The DfE will use this figure with school performance data on public websites such as the Explore education statistics website.
APS points per entry in GO 4 Schools – Headline measures
The APS per entry scores and grades are shown on the Year 13 Key statistics page available under Pathfinder>Year Groups>Year 13 > Year group key statistics for all grade types. The screenshots below have been amended to show references to APS per entry and Grade per entry for each cohort.
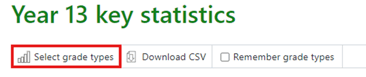
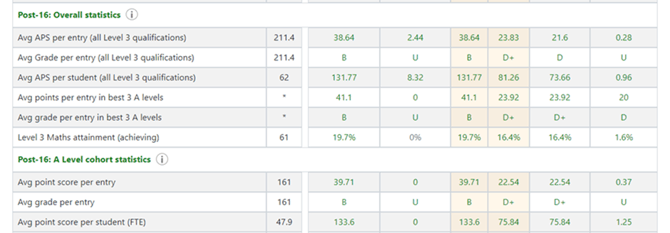
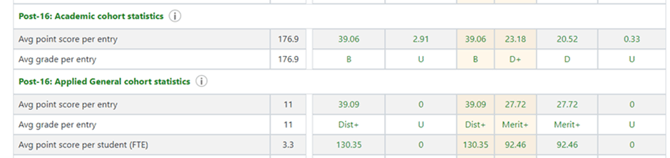

Grade types can be added or taken away, as required, using select grade types (highlighted in red).
By clicking on any of the figures you will be able to drill down to see student level. This is covered in the section APS points per entry in GO 4 Schools – Analysing individual performance in explorers below.
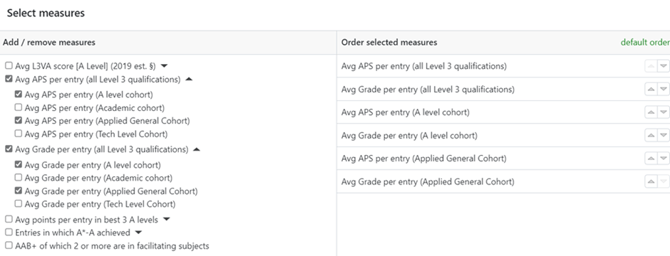
The GO 4 Schools Attainment over time page available under Path Finder > Year Groups > Year 13 > Attainment over Time enables manipulation of all the Average APS points per entry statistics.
On the Attainment over time page you will be able to select which measures you wish to compare, by selecting the Grade types box as shown above. The columns can be ordered (highlighted by the green box) and also saved as a selection (highlighted in blue). The second screenshot shows the selections to create this table.

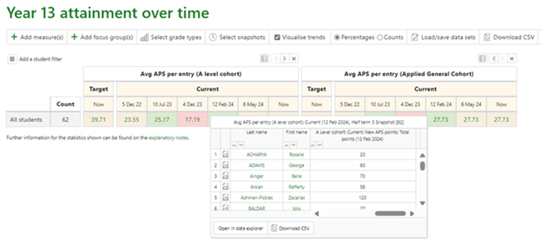
By selecting snapshots (highlighted below) different report and/or data snapshots can be selected. The visualise trends selection will colour grades when they go up (green) and down (red) when you select two or more different time periods.

Selecting a particular figure will give individual scores and by selecting Open in a data explorer this will open up an explorer and enable the data to be interrogated further.
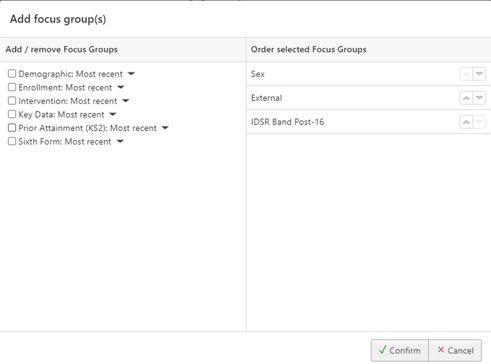
By adding focus groups via Add focus groups, data can be viewed for your key interest groups. The Demographic section comes from your MIS (system attributes). We have created a bespoke set called Sixth form (for more information about attribute and attribute sets – click here). Gap values are displayed when there are two values.
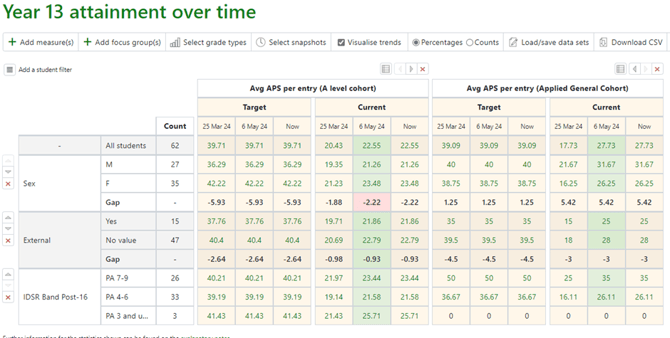
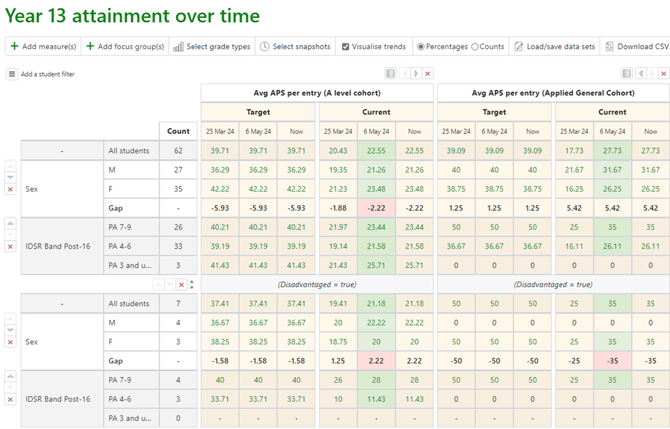
All data can also be filtered by selecting the Add a student filter button, below is filtered by Disadvantaged: True, and the resulting table shows values by sex and IDSR band for the whole cohort and then those groups filtered by disadvantaged.
APS points per entry in GO 4 Schools – Headline measures over multiple time periods
By clicking on full statistics (shown in red in Fig. 3.) and then clicking on change (shown in green in Fig. 3.) you will be able to turn back your headline statistics to previous report or snapshotted periods e.g. October reports, Mock grades. This supports comparative analysis of all key statistics over time. This feature is also available for department data. How to snapshot data and reports is detailed in the report managers guide.
APS points per entry in GO 4 Schools – Departments
Overall department data for APS per entry at subject level can be viewed on the main year group page (Path Finder>Year Groups>Year 13>Curriculum Analysis). At the top of the page you will see a section labelled Year 13 subjects. If you click the add ribbons section shown in Fig. 6.
Fig.6.
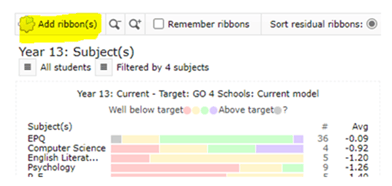
By selecting the “add ribbon(s)” in the top left of the image above you will be able to make a choice to display which Progress and Target Grades and their corresponding APS points you would like to view. Additional grade types can be selected by selecting include all grade types as shown is Fig.7.
Fig.7.
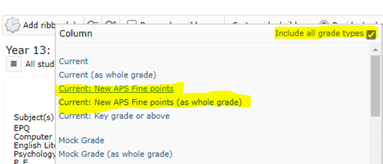
In this case in we have chosen to look at the current grade both as fine points and as whole grades. Fig. 8. shows the display of the tables.
Fig. 8.
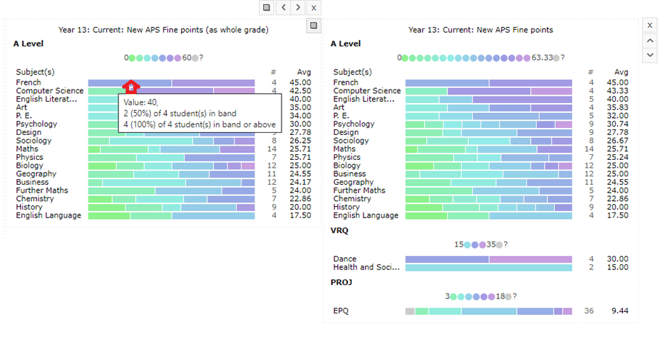
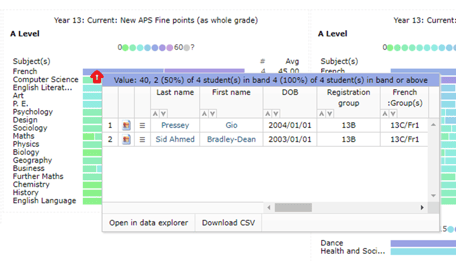
By hovering we can see the value of 40 APS (see Fig.8.) and how many students are achieving that particular value (in this case two students). By clicking on a ribbon (see Fig.9.) we can see a list of students who are in the band and have links to the subject data explorers and we are also able to download this information as a .csv (See Fig.9.).
Fig. 9.
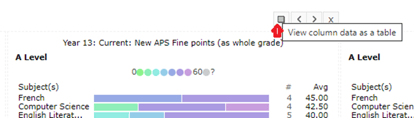
Furthermore we can look at this data in tabular form by selecting the hatched box when you navigate to the top right of the ribbons (see Fig.10.)
Fig.10.
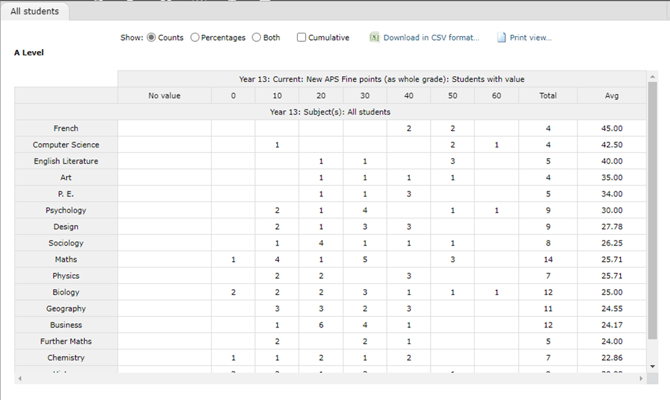
This generates a scrolling table seen in Fig.11. There are options here to hover and click as we were able to do on the ribbons themselves and there is an option here to show data as counts, percentages or both.
Fig.11
Overall department data can also be viewed by clicking the full statistics button (highlighted in red in Fig. 3.). In the same way as at Key Stage 4 you can view average numeric GCSE points by subject, at KS5 you can view APS points per entry by subject. There is an option for fine points or standard points (see Fig. 12.).
Fig. 12.
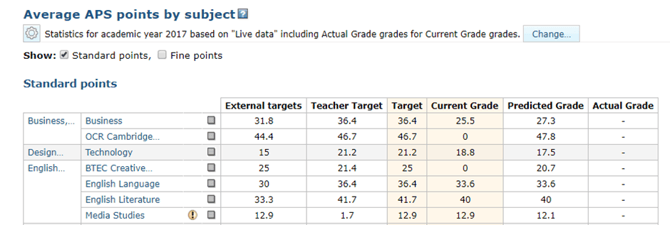
In the detailed statistics the standard points table above brings together all the entries in a subject and produces an average point score per entry. This follows the methodology that a B+, B and a B- are all worth 40 points etc.
Fig. 13.
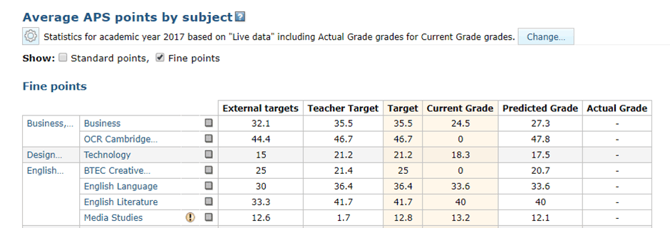
Fine points will sometimes show that a subject is higher or lower in terms of performance than when analysing by standard points. When inputting grades in GO 4 Schools a B+ grade is treated as 43.33 points a B grade as 40 points and a B- as 36.67 points (see Fig. 14). The lower grade is treated as below the threshold grade for the subject. This mirrors the DfE look up table for APS points in the 16-18 guidelines. Remember that the DfE will turn your overall cohort APS figure into a published grade (see Fig. 15.) so it may also be beneficial to consider these grades at departmental level.
Fig. 14.
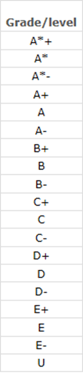

Fig. 15.
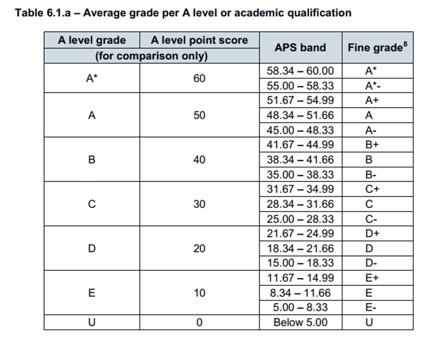
For example, if a course with three students achieved A, B, C- the total points for this would be 50+40+26.67 which then divided by 3 would equal 38.89 which would be a performance grade of a B.
If we look at the APS points for the current grade for Business (Fig. 12) this is 25.5 points which as a grade is a C-. The target at 36.4 is a B-.
It is worth noting that GO 4 Schools treats an A*+ as 63.33 points. This is the only grade that is inconsistent in Fig. 15. as the table does not have an A*+ grade. You may want to consider use of this grade with your subject staff.
Fig. 16.

Fig. 16. is available in every subject page (Pathfinder> Departments>Subject>Select appropriate Year 12/Year 13 course). This table provides a summary of target and progress grades with all students included and also where only students with an input grade are included.
Both standard points and fine points are available for further analysis in the year group and subject explorers at student level.
APS points per entry in GO 4 Schools – Dual registration - subsidiary students
Dual registration - subsidiary students will be included in subject statistics but not in headline statistics. Dual registration – subsidiary students can be forced into the headline measures by going to Student Attributes>Student Attributes>Student Statistics Rule>manage values and selecting each individual to be Included in stats. Dual registration – main students will automatically be included in both sets of statistics.
APS points per entry in GO 4 Schools – Focus groups
Focus groups can be added and filtered to look at performance for key performance groups such as disadvantaged, prior attainment or bursary etc. They can also be used to highlight school specific groups to support underperformance such as a mentoring group. We have produced a document which outlines the most used and recommended focus groups.
To see how to set up school and year group specific focus groups using student attributes please click here.
By clicking on focus group (see blue box highlighted in Fig. 17.) you can see all the statistics for your cohort against a particular focus group. If every student has a value entered (e.g. Yes/No in the disadvantaged example below) then there will be gap data displayed against all your selected grades.
Fig. 17.

Fig. 18.

Fig. 18. shows the disadvantaged group. This shows that the disadvantaged students are on average 0.9 of a grade lower than non-disadvantaged students when looking at the current grade. However, their current performance against target is significantly better (25.2 against 30.9 versus 26.1 against 36.5). Using this data in conjunction with the L3VA data which is a progress measure (reported in AY 2024), will help you to build up a picture of performance across all your different cohorts.
The DfE performance tables for Post 16 will include individual school disadvantaged data which will be displayed against the non-disadvantaged national figures for each cohort (a sample measures report detailing all the current performance indicators is available here). From Page 9 onwards of the linked document the disadvantaged performance indicators are displayed.
NB: The national average points score per A level entry in 2023 for non-disadvantaged pupils was 34.82 APS which expressed as a grade is a C+ (see Fig. 15. For more details).
For the applied general cohort, the national average points score per A level entry in 2023 for non-disadvantaged pupils was 30.10 APS which expressed as a grade is Distinction. These are figures that we expect schools to track their data against in the forthcoming years as further national data is released.
A view of all school selected focus groups with regard to a particular statistic can be seen by selecting full statistics from the main Year 13 page (see Fig. 17. In red) and then selecting show/hide focus groups at the top of the page (see Fig. 19. in red). In this case the school has chosen to select ALPS profiles, expected destinations and disadvantaged as their focus groups
Fig. 19.
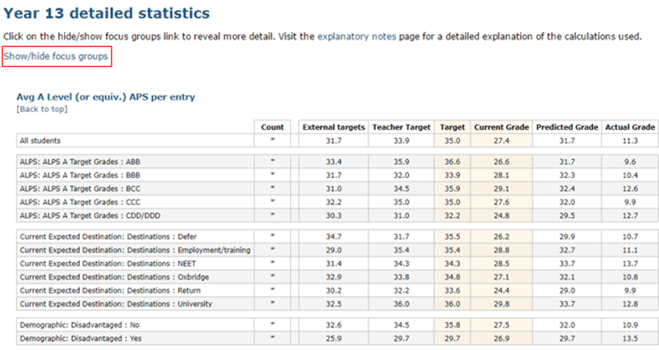
This information facilitates an understanding of performance against prior attainment (if not using ALPS many schools have created their own prior attainment at KS4 bands or the ones stipulated by the Post 16 IDSR), expected destination of a student (another key government focus) and also as we have seen previously in this section, disadvantaged.
APS points per entry in GO 4 Schools – Analysing individual performance in explorers
Once the headline data has been absorbed it is important to understand individual student data that underpins it to celebrate good and outstanding performance and to inform intervention after highlighting under-performance.
Fig. 20.

By clicking on the current grade figure or on the grade (in this case the A Level cohort highlighted in red in Fig. 20.) this will give a summary of the total points, the students corresponding grade and the number of entries for each student in the specific cohort.
Fig. 21.
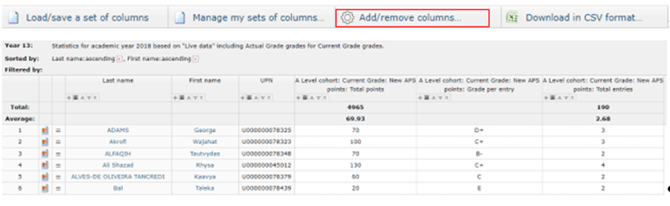
By using the add/remove columns highlighted in Fig. 21. there are a number of fields that can be added to the explorer view.
Fig. 22.
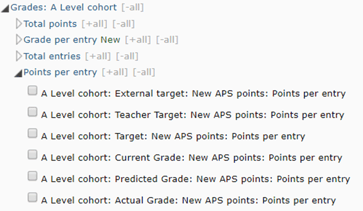
Fig. 23.

In Fig. 23. Current APS per entry and target APS per entry have been added. The cohort is on average one grade (10 points) below target. At student level Tautvydas is half a grade below target across his two entries, Rhysa is a quarter of a grade below target across her four entries and Taleka is two grades below.
APS points per entry is one of the many key statistical outputs that GO 4 Schools provides and it should be used in conjunction with other outputs to gain a full understanding of individual and group performance (highlighted in Fig. 25.).
Fig. 24.
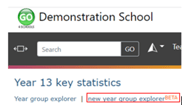
Another way of accessing this data is through the year group explorer at the top of the Year 13 key statistics page (see Fig. 24). The link will take you through to the explorer view which will have all the students in your year group listed. By selecting add/remove columns we have added target APS points per entry against current grade APS points per entry. An L3VA score has been added and sorted from lowest performer to highest performer (using the up arrow highlighted in red). We have also added a raising attainment group and filtered by extra mentoring (EM – using the filter button highlighted in green) to review performance in this specific group.
By saving sets of columns (highlighted in green in Fig. 25.) you can return to this data at any time and scores will be updated as staff input data in to markbooks.
Fig. 25.
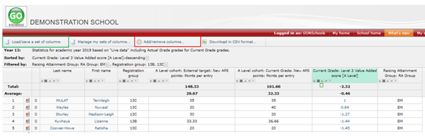
This information is normally the beginning of further investigation. Student number five has 20.00 points per entry based on her current grades in the A level cohort against a target of also 20.00 points per entry, but what is the subject breakdown? Is she actually performing to her potential? By clicking on the name of the student you will be able to see the full breakdown of individual grades when selecting a value from the L3VA table (in this case we have selected a grade from the current grade column highlighted in blue in Fig. 20.).
Fig. 26.

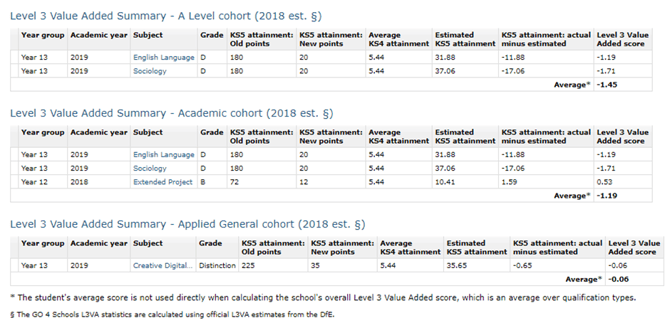
This breakdown shows that considering her prior attainment, the student is actually considerably below (over a grade) the estimate for both her A Level subjects based on her current grades (if using the 2019 Ready Reckoner L3VA data). This may cause the school to review the targets set for this student. This demonstrates that analysis of APS points per entry should be used in conjunction with the L3VA measure. On this page it also shows she is taking a course in the Applied General Cohort so a full view of her courses is seen here.
Fig. 27.