
The DfE changed the accountability measures for the end of academic year 2024 to include Level 3 Value Added (L3VA) for the first time since 2019. This provides greater emphasis on progress and progression alongside previously reported attainment measures.
GO 4 Schools provides schools with immediate L3VA data based on school defined targets and grades inputted by staff.
L3VA data comes from the DfE Ready Reckoner which is updated in our system soon after the DfE publishes these for schools to access. Unvalidated data will be published in Autumn 2024, with the validated data which is used in IDSR creation and that can be used in OFSTED inspections due to be published in early 2025. We will alert schools when both data sets are ready to use in GO 4 Schools.
It is worth noting at this point that L3VA data is retrospective data using comparable outcomes and should be used to indicate performance and tracking and may not actually match the actual figure the school achieves as student outcomes nationally vary year on year.
For L3VA data to be enabled in GO 4 Schools the students average APS for GCSE (for the A Level and Academic cohorts) and the average APS of GCSE/Level 2 qualifications (for the Applied General cohort) must be uploaded in to the prior attainment (KS4) set of attributes.
You should follow the following video carefully as for the three streams of L3VA A Level, Academic and Applied General cohorts the average points score for the same student may differ.
How to add prior attainment data for L3VA
Cohort scores for A level, Academic and Vocational (Applied General) can be turned on and off in Curriculum > Statistics and analysis settings. This is useful for schools who focus solely on A level courses or Applied General courses.
L3VA Outputs – Analysing year group performance
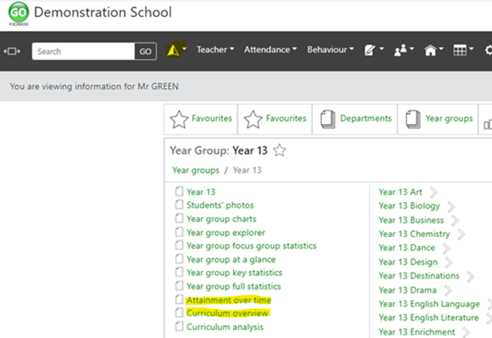
L3VA data can be viewed at Year group level and also department level using the Attainment over Time and the Curriculum overview pages:
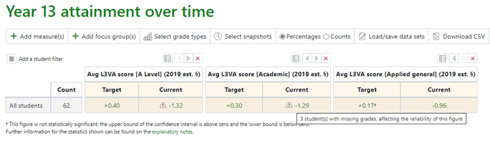
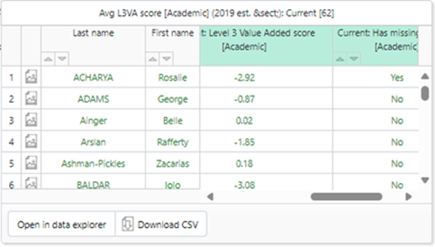
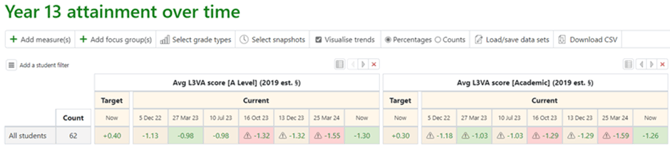
The Attainment over time page will show data from all three cohorts. You can add grade types and select snapshots to view all your different grade types and view performance over time. Exclamation marks indicate there is missing data, hovering over the exclamation mark will indicate how many students have missing data. Clicking on a figure will open a mini explorer view that will show you individual values for students, as well as if they have any missing values:
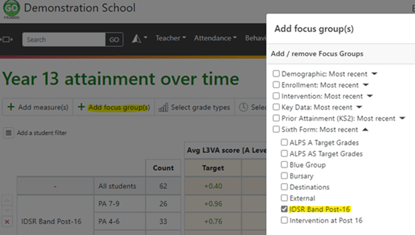
You can select a focus group to view this data. In this case the IDSR prior attainment bands have been selected
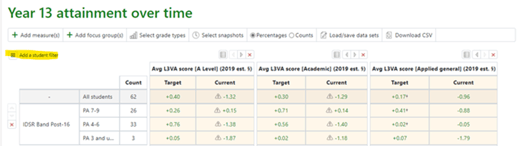
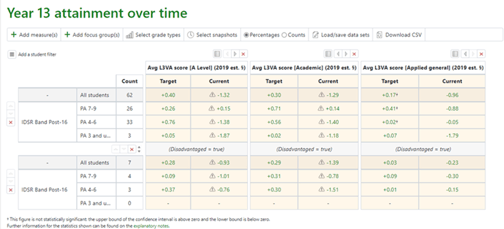
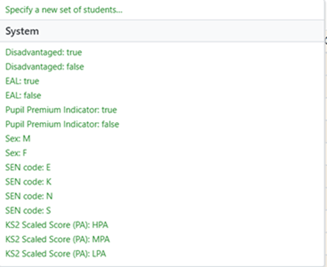
By adding a student filter you will be able to filter your original selection. In this case the Disadvantaged students are filtered by prior attainment bands.
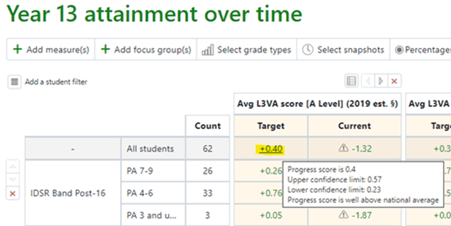
Hovering over a score will give you Upper and Lower confidence intervals which determine the DfE progress band that this score falls in to.
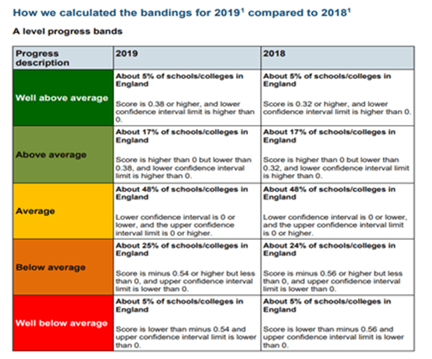
The Upper and Lower Confidence intervals and band displayed are as per the L3VA methodology:
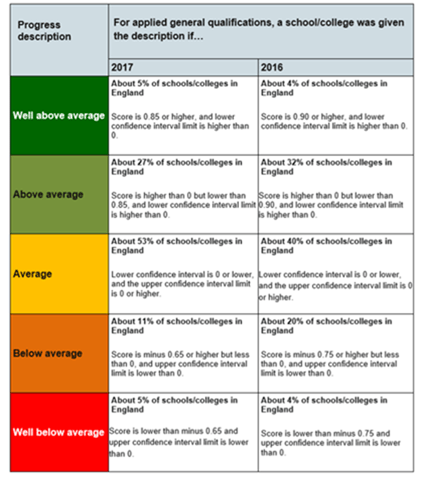
This supports understanding throughout the year of where current and predicted grades are against the ready reckoner estimates at year group and departmental level. We recommend schools consider confidence intervals carefully when looking at L3VA data as small cohorts can sometimes produce scores that are considerably positive or negative but have large confidence intervals.
Setting up focus groups for L3VA
L3VA data can be viewed by a particular focus group (for a list of recommended focus groups please see - Focus Groups for Post 16) or all focus groups to inform intervention and for monitoring the gap between groups.
Focus groups can be set up on the student attributes page to be specific to the school e.g. interventions or standard categories such as disadvantaged (see the attributes section of the school managers guide).
For categories such as disadvantaged we have created a special attribute which requires a yes/no value to be added to an academic year date stamped set. This will also populate the school dashboard, trust and governor view (depending on your school settings). The performance of disadvantaged students is included in the DfE performance tables so it is important that schools track on this data.
Attainment over time - analysing L3VA scores across reporting periods
L3VA data can be viewed over time by navigating to the Attainment over time pages (Pathfinder > Year 13 > Attainment over time). These pages allow you not only to analyse L3VA data but also combine them with other measures of your choice such as APS points per entry (see blue box below).
Using the menu from the red box below enables you to select various combinations of all your active grade types. The menu highlighted by the green box enables you to save column sets for yourself and/or other users.
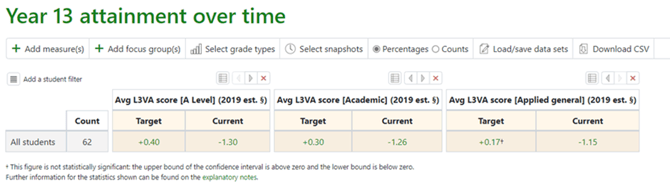
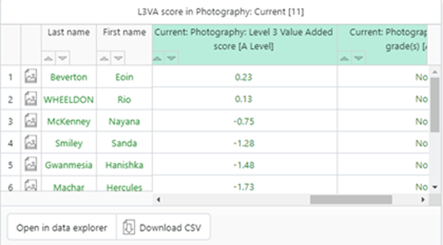
By clicking on any of the numbers in the table there will be a pop out of student data, in this case the average L3VA score for each student will be shown (please note that the average score does not contribute to the overall progress measure but this is a useful guide to how each student is performing). This will also take to you a year group explorer by clicking open in data explorer where the data for the cohort can be analysed further.
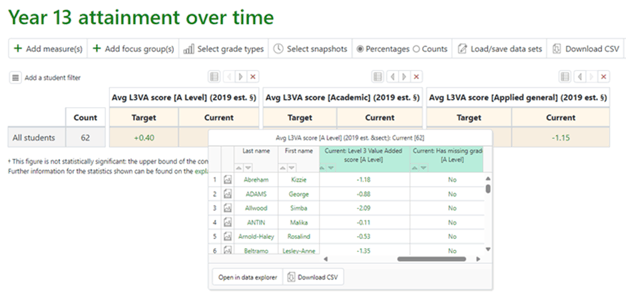
The attainment over time pages also help you to view data trends at particular reporting and/or snapshot points. Red indicates a decrease from the last data period, green highlights an increase.
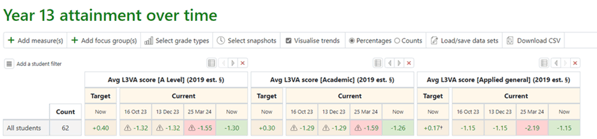
This can show data in both the current year and over the two years of the Post 16 courses.
Curriculum overview - analysing L3VA by subject
L3VA subject data can also be reviewed in the Curriculum overview pages (Pathfinder > Year 13 > Curriculum overview).
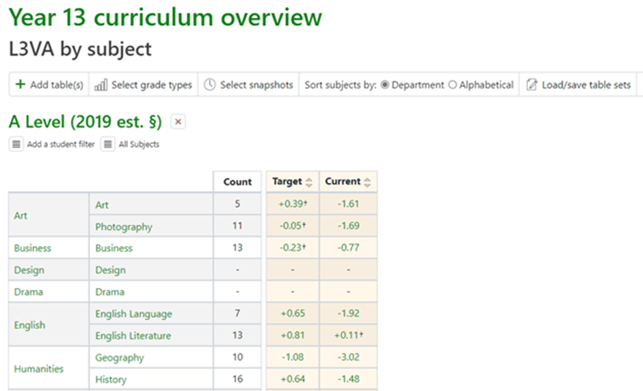
By clicking on the values individual student data for each subject can be seen:
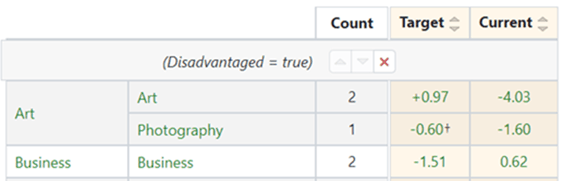
In addition to the table multiple interest groups can be added to produce further tables by selecting “Add a student filter”:
L3VA data – looking at student level scores
If you click on a figure in the L3VA data, such as the current grade for A level, GO 4 Schools will show you the breakdown of scores for those students in an explorer. It is worth noting here that the average at the top of the explorer will normally not match the figure in the core table. This is because the average score methodology for L3VA is not calculated from the students’ averages, instead it is calculated from the subject averages (as per DfE methodology).
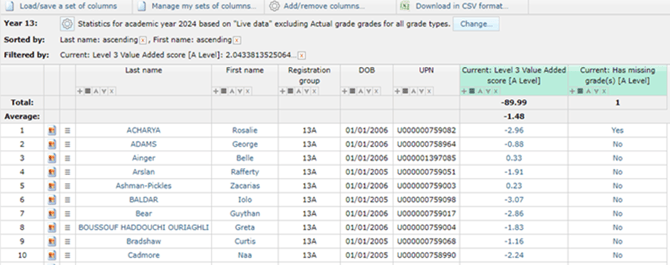
Using the add/remove columns button you can create views that are more suitable to your context and create your own intervention lists. This example focuses on disadvantaged but could focus on any group of students that you have highlighted as of particular importance (see focus group document).
In the example below we have:
- Added a yes/no column for disadvantaged (using the add/remove columns button)
- Filtered the disadvantaged column to only show yes
- Added a prior attainment score and the predicted L3VA score (using the add/remove columns button)
- Sorted the scores from lowest to highest using the sort button
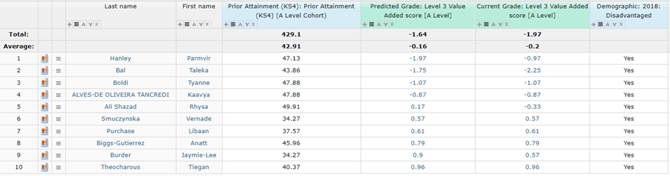
Scores can be sorted and filtered to aid production of intervention lists.
These column sets and filters can be saved and the values in the grades columns will update in real time, as soon as a member of staff changes the grade in a markbook or in a set of reports.
Student Postcards for L3VA
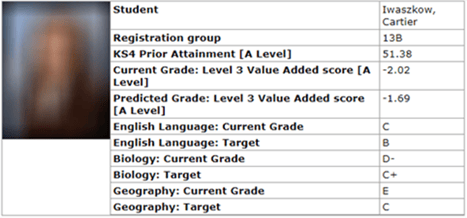
Student postcards can be created from the explorer view by selecting the student postcard view which is in the top right corner of every subject and year group explorer.
Below the student has been highlighted as an underachiever in all subjects against target they are predicted to get almost two grades below the national average for a student matching their prior attainment ability in their chosen subjects. Individual L3VA scores for each subject can also be added
Analysing L3VA in more depth at student level
By clicking on a student in a markbook, explorer or searching for a student in the search bar you will be able to see student profile data. Depending on which GO 4 Schools modules your school uses you will be able to see a detailed breakdown of academic performance, homework, attendance (by lesson if you have GO 4 Schools attendance) and behaviour, enabling you to understand performance in more detail.
By accessing the Progress tab on the student page, you can see their L3VA scores at the top of the page:
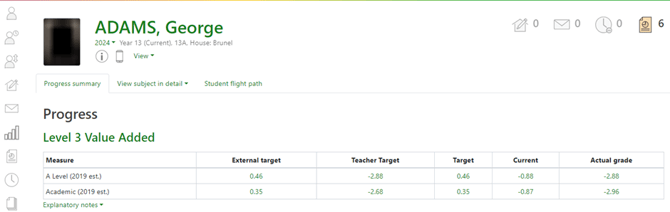
If selecting a grade, for example Current you can view performance against the L3VA estimates. At the bottom of the L3VA breakdown page are tables for each cohort the student is a member of. The A Level cohort score for this student includes Mathematics, Physics and French data.

The student’s C- in Mathematics (30 points) is above the estimated 29.70 points (the estimated points have come from the 2019 ready reckoner based on his prior attainment of 5.91). This gives a subject score of 0.03. This has been calculated by taking his current points score of 30 points and subtracting the estimated score for his band of 29.70. The score is then divided by 10 to give an overall subject score of 0.03. The student score of -1.53 in Physics is over a grade below national expectations (based on the 2019 national cohort) and they are well below target based on the school’s target setting. This data can often be helpful when reviewing student targets.
As stated previously the average score of individual students is not used in the calculations for key performance indicators but is often useful in understanding student performance across subjects.