Introduction
Schools are required to regularly report attainment data broken down by FSM and sex to their Consortium. To help with this you may want to follow the guidance in this document to create a focus group broken down by:
- eFSM boys
- non eFSM boys
- eFSM girls
- non eFSM girls
Preparing your file for upload
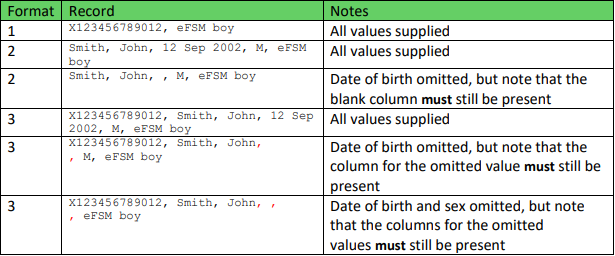
Three different record formats are supported for your convenience:
UPN, Value (in this case, FSM status and sex)
Last Name, First Name, Date of Birth, Sex, Value
UPN, Last Name, First Name, Date of Birth, Sex, Value
You can use different formats for different rows within the same file.
In all cases, the last value is the attribute value, and all other values are simply used to identify the student.
Please note, it is essential that you are consistent with your value choices, i.e. how you choose to represent each of the four sub-groups as if there is a variation (for example using FSM boys and FSM-Boys) GO 4 Schools will create a sub-group for each variation, affecting your analysis.
Some sample valid records for the attribute are shown below:
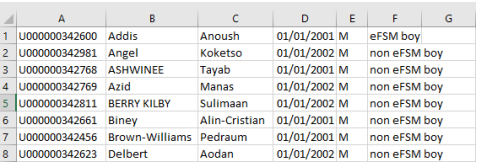
For example:
Some sample invalid records:

All student identification values in a record are optional, but whatever values are provided will be used to try to identify a unique student for that record. (Remember to include columns for missing values.) When trying to identify a student, GO 4 Schools will check the first name and surname provided for a student against the legal and preferred names retrieved from your MIS. If provided, it will also check that the sex and date of birth are consistent with the data from your MIS. If a unique student cannot be identified, the record will be rejected.
If multiple records for a student can be found in a file all those records will be rejected.
Validation
As well as checking the student’s details, GO 4 Schools uses the following rules when interpreting the contents of a CSV file:
- Attribute files can not contain header rows.
- Records that do not match one of the formats above are rejected. This includes blank lines.
- Dates (whether dates of birth or values to be held for attributes) can be provided in a wide range of formats, but the recommended format is dd/mm/yyyy e.g. 31/12/2011. (A date such as '12/2/2010' will be interpreted using a UK format as 12th Feb, rather than 2nd December.)
- Sex can be provided as M, F, m, f (i.e. it is not case sensitive.)
Creating the attribute
The Student attributes pages can be accessed by School Managers using the Student attributes option under the Student attributes drop down list on the people menu. You should click the Create a new student attribute button, found at the bottom of the page, which will take to the Create a new attribute page shown below.
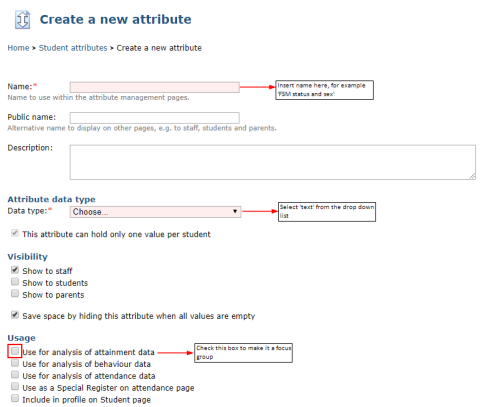
When you click save at the bottom of this page, you will be taken back to the Student attributes page.
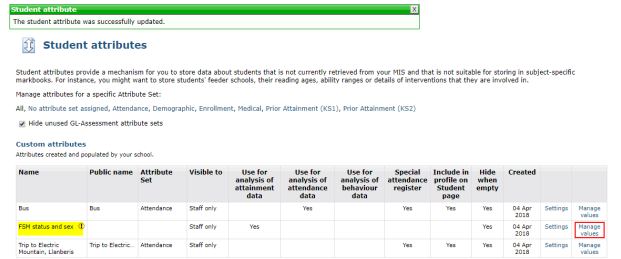
Click on the Manage values link which will take you to the Manage values for attribute FSM status and sex page where you choose to Add a new set of values….
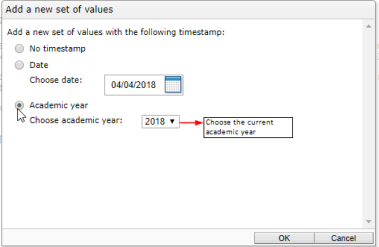
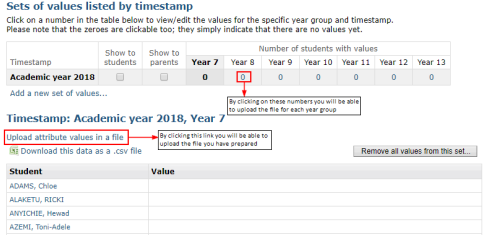
From the page below, you can upload the information for all year groups:
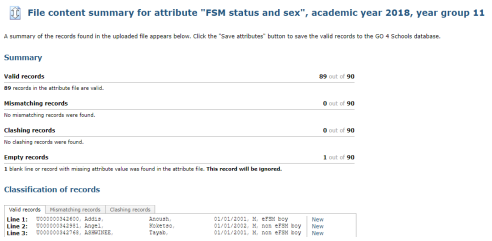
The following page will display the number of records that were valid, the number that were “mismatches” (i.e. that do not uniquely correspond to a known student), the number that were “clashing” (i.e. that will change values already held in the database), and the number of empty records. You can review the records in each category using the “tabs” at the bottom of the page. If you are happy with the set of valid records you can save them to the database by clicking the Save attributes button.
Using for the analysis of attainment data
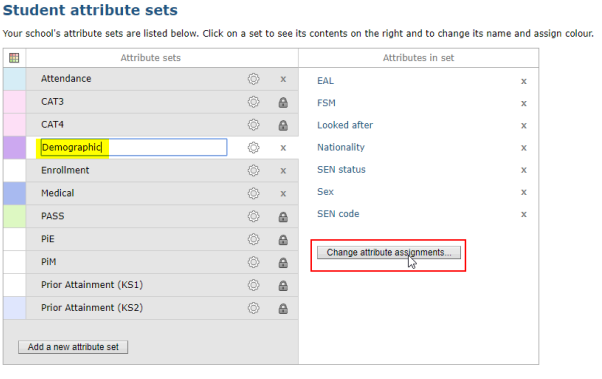
Before you use the newly created attribute you first need to add it to an attribute set. If you go to the Student attribute sets option under the Student attributes drop down list on the people menu, you will find some default sets for system attributes are already available for you, such as Demographic, Enrolment, etc., as well as any other attribute sets created by your school. The Attribute sets column on the left shows sets available. The Attributes in set column shows the individual attributes within the selected set. I will be adding the FSM status and sex attribute to the demographic set that already exists, but you may wish to add it to an already existing, school specific, set.
Click on the attribute set you wish to add it to and then on the Change attribute assignments button:
 Then tick the box for the attribute and click save.
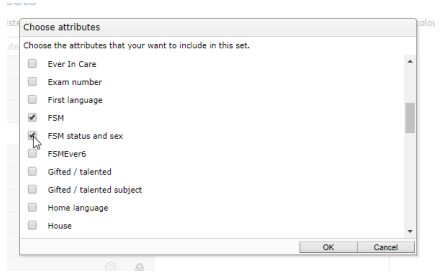
FSM status and sex can now be analysed at a year group, subject and teaching group level.
Year group page
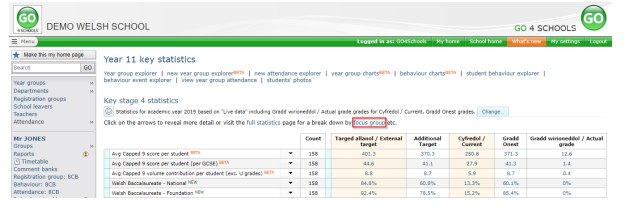
From the year group page click on focus group:
And then Choose a focus group: 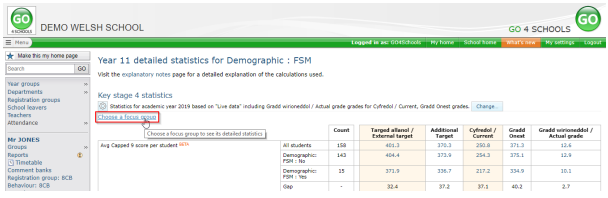
You will then find the attribute prefixed by the name of the attribute set you placed it in (in this case Demographic):
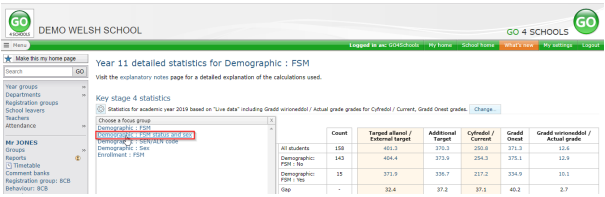
You will then have a breakdown of our KPI table by all students and the 4 categories:
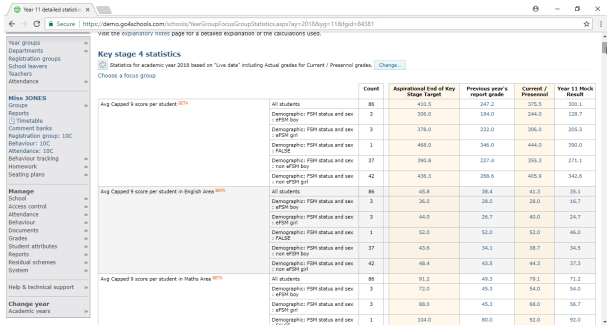
Subject page
From the subject page middle (or senior) leaders can choose to either analyse the data using the new charts, or the new ribbons (if they have been enabled).
Using charts to analyse the data (if you have them enabled)
Please note that in order to carry out analysis using the charts and ribbons, they will first need to be enabled. Please create a ticket for our support team to either enable them for school manager only, school managers and curriculum leaders or for all staff.
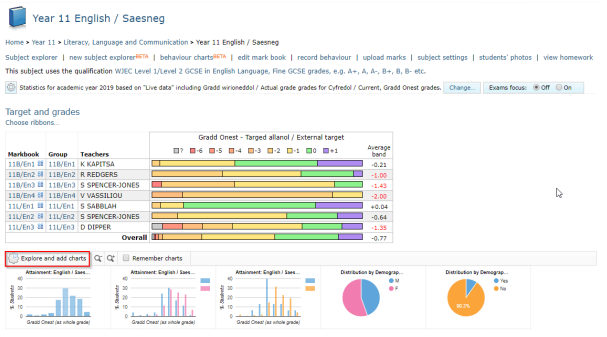
In order to have the relevant charts appearing on the subject page you will need to first select them via the Explore and add charts link:
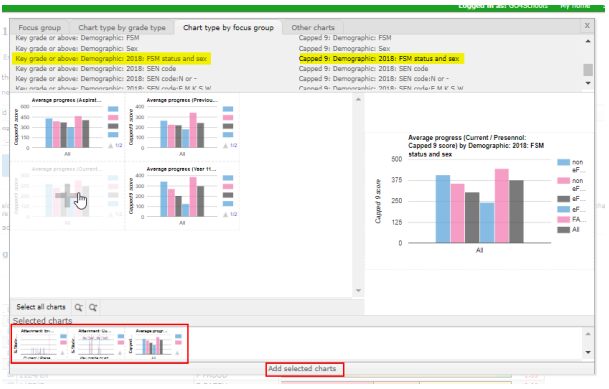
By clicking on the Chart type by focus group tab I can select the relevant charts. In the example below I have selected to view my focus by grade distribution, and the previewed chart on the right had side is showing grade distribution based on the current grade. There are four charts available for grade distribution in this example as I have four grade types (combination of progress and target grades) enabled via my grade settings.
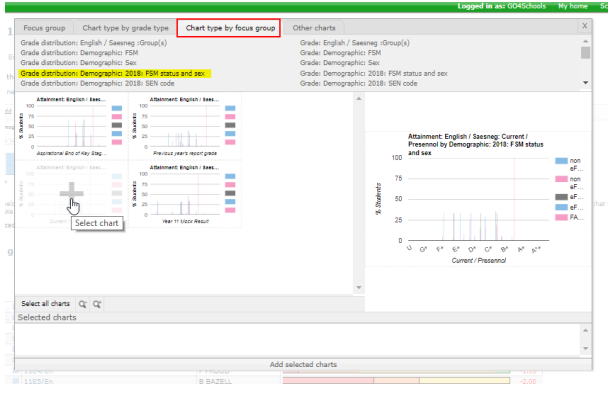 When you click on a selected chart they will appear towards the bottom of the box. In the example below I have selected charts showing the current grade by grade distribution, key grade or above (i.e. grade C or above) and Capped 9. By clicking on Add selected carts at the bottom of the box these charts will be added to the subject page.
By ticking the Remember charts box they will be saved for each time you log on to GO 4 Schools on the same machine until you clear your cookies. You may want to hide any of the charts you are not using by clicking the X.
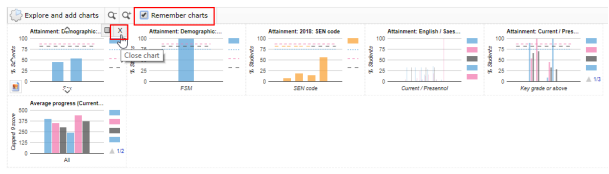
In order to view an enlarged version of a chart click on the hashed box as shown below:

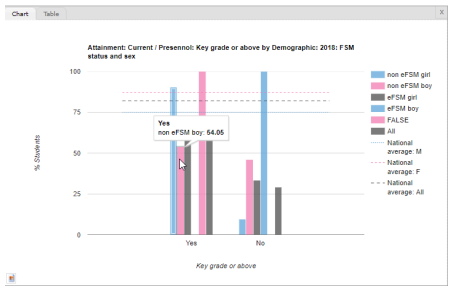
By hovering over the bars, you can see the percentages achieving that measure:
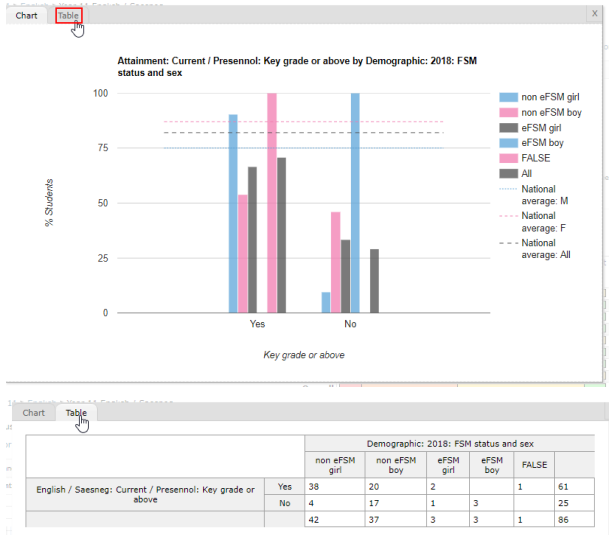
By clicking the ‘table’ tab you can view the raw data in table form as shown in the images below:
Using ribbons to analyse the data (if you have them enabled)
The new ribbons can be found on the subject page (or a group page) below the at a glance ribbons.
These new ribbons allow you to view the data in two different ways:
- Subject results as a whole, broken down by each of the sub-groups
- Results broken down by teaching groups for one of the sub-groups at a time
By clicking the Add ribbons link (found above the new ribbons) you will be able to access a window where you can select your focus group and the column, as shown in the images below:
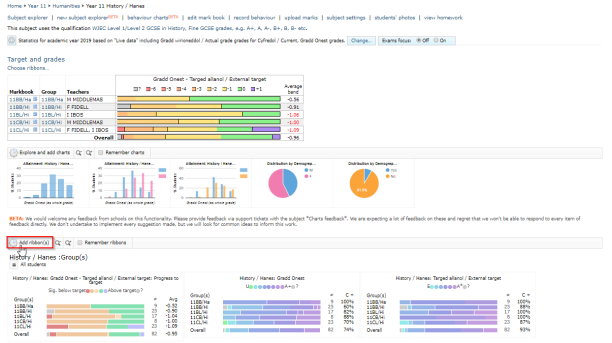
By selecting the FSM groups row and column displaying key grade or above you will have a breakdown by percentage of each sub-group on a C or above.
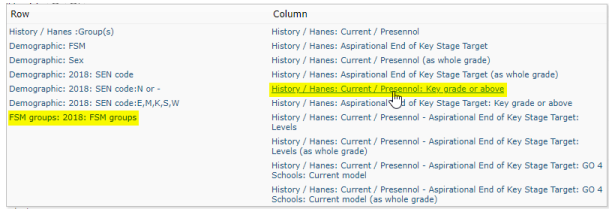
A new row of ribbons will then appear displaying your selections (you may need to scroll right to view the key grade or above ribbon as it will appear at end of the three default ribbons). In the example below the third default set of ribbons has been hidden:
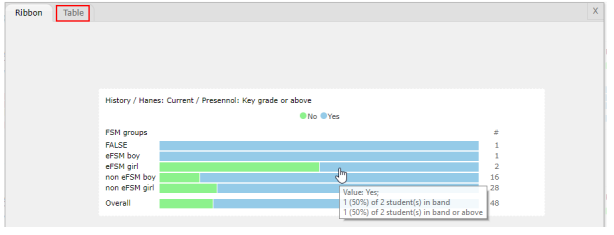
 By clicking the hashed box in the top right-hand corner of the ribbon you will be able to access an enlarged image of that particular ribbon and the data sitting behind it:
 Hovering over a ribbon’s section will display a tool tip providing the number of students contributing to that element.
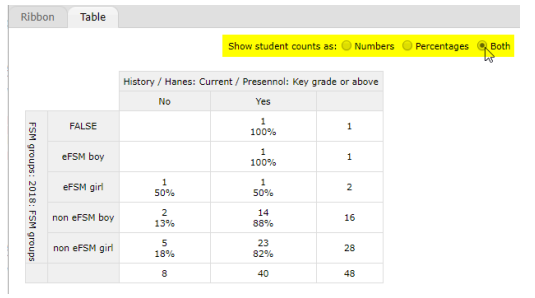
Clicking on the table tab will take you to a page displaying the ribbons data in table form.
You can select whether you wish to view the data as numbers, percentages, or both.
 By clicking the Add students hamburger you will be able to select one of your sub-groups. Please note you cannot select them all at the same time, you will need to do them individually to produce a set of ribbons for each of the sub-groups
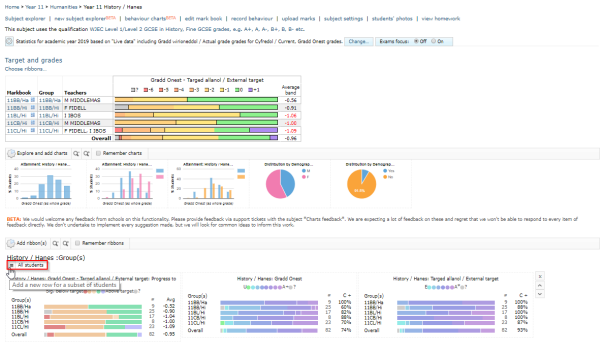
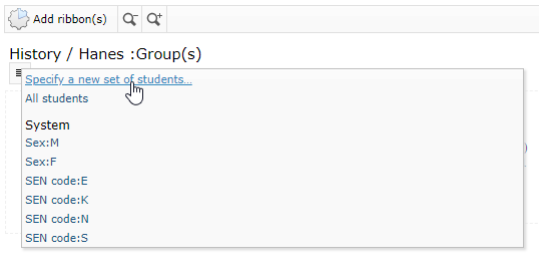
Tick the box of the sub-group you would like to view first:
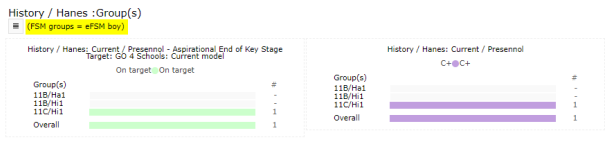
Group page
The same analysis (chart and ribbons) is available at a group level by following the same steps as above: