
Introduction
Horsforth quadrants are increasingly being used by schools to plan targeted and appropriate interventions across a cohort in an aim to drive pupil progress. They work by measuring a pupil’s average effort (or Attitude to Learning) against their residual (current or projected grade compared to target) and can be easily set up in GO 4 Schools, especially if you already collect attributes via the report section. It is important to mention that you can use either the overall student Progress 8 figure or the overall average residual (the difference between the current/projected grade and the target) to compare student progress.
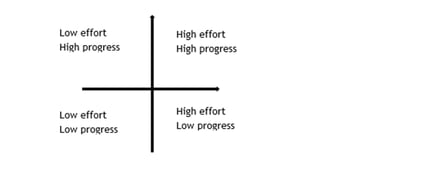
Generating the report attribute: average effort grade
During your regular reporting cycle you may collect effort grades either via your markbooks, the report attribute marksheets, or directly via the report section, if you do not currently do this please refer to this article.
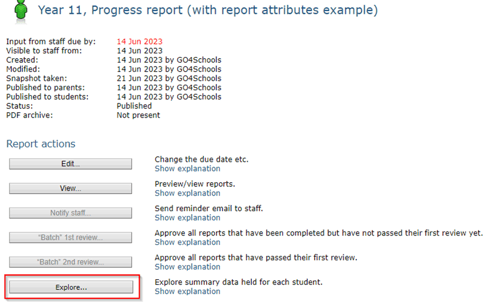
Once your reports are ready, and your teachers have all entered the attribute grades, GO 4 Schools generates the average for you in the report explorer. The explorer can be found on the Report management page, then selecting the relevant report and the clicking the ‘Explore’ link:
Once you are in the explorer, tick the box to show report attributes (highlighted below) and then click reload:

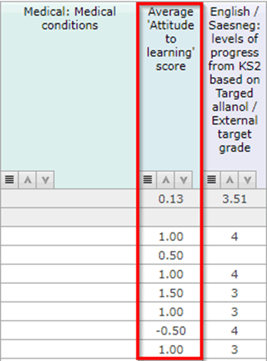
The final blue column of the attributes section will be the average for each student:
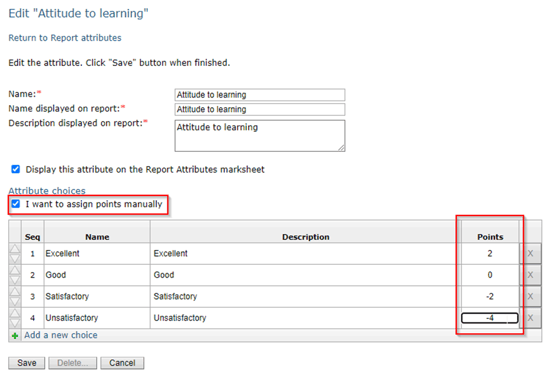
Note: You will need to adjust the points assigned to each report attribute grade for use with the Horsforth quadrants. This is achieved by ticking the box entitled ‘I want to assign points manually’, and then changing the points so that there are corresponding positive and negative values. In the example below excellent carries positive points, good 0, and requires improvement and unsatisfactory carry negative values. This will not impact the names of grades that staff see, or those displayed for parents on the reports, but will aid in the generation of an average that can be used to generate the scatter plot graph for the quadrants.
Viewing the average effort grade in year group explorers
Access the new year group explorer via the following link:

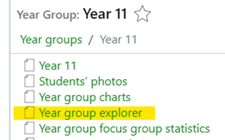
Or via the Pathfinder menu > Year group > Year group explorer:
Select ‘Add/remove columns’:

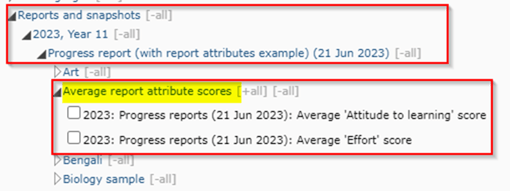
Select ‘Reports and snapshots’ to locate the reporting window containing the attributes:
Viewing the average residual value
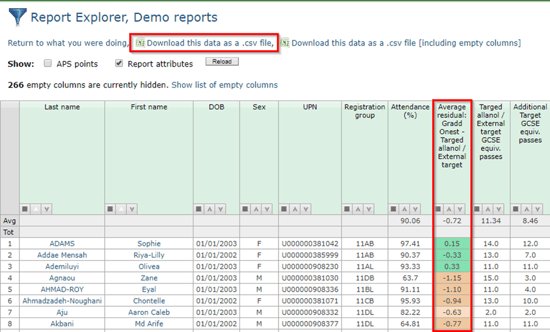
Once again this can also be found in the report explorer:
Viewing the average residual in year group explorers
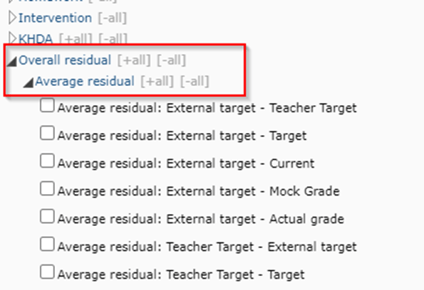
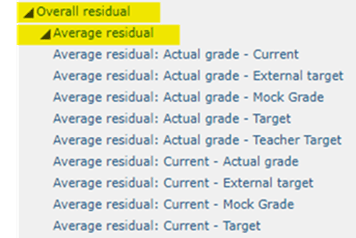
Select 'Add/remove columns', and then Overall residual > Average residual. Select the two grades you wish to use to generate the residual value:
Creating and populating relevant attributes
In order to generate the relevant charts and to track the 4 four groups it will be necessary to create the following custom attribute:
- Horsforth quadrant group – will contain either Accelerate, Action, Ambition or Aspire depending on which quadrant the pupil is in (note: guidance on how to generate these groups is provided below).
If you wish to use the bulk upload functionality in GO 4 Schools please follow the steps outlined below, if using this method there is no need to make the attributes in advance:
- Using the CSV downloaded from the report module, remove all columns except the following 3 (note: the headings for your columns will become the title of the custom attribute):
- UPN
- Horsforth quadrant groups
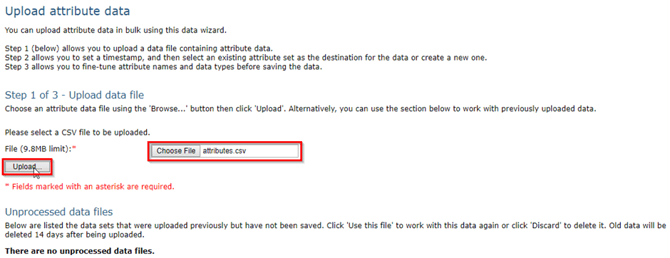
- Select ‘Student attributes > Upload attribute data’ in the Curriculum menu.
- Select the CSV file you created in step 1 and click upload:
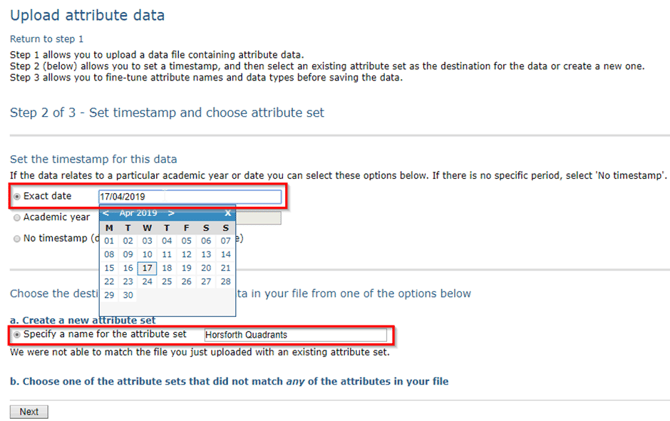
- You will need to timestamp the uploaded data, and for purpose of this guidance I have selected today’s date. These attributes will be placed in a new set (if you have not made one in advance) if you select option ‘a. Create a new attribute set’. If you wish to place the data in a pre-existing set please use option b and select the appropriate set.
- Step 3 of 3 allows you to refine the attribute set and check your data is valid. If you are satisfied that everything is correct click ‘Finish’ at the bottom of the page.
- Click into the newly created attributes and enable them for the analysis of attainment data.
Using charts in GO 4 Schools to generate Horsforth quadrants
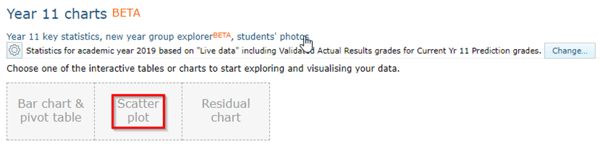
To access the year group charts section of the site select the ’Year group charts’ link as highlighted below:

- Select the Scatter Plot:
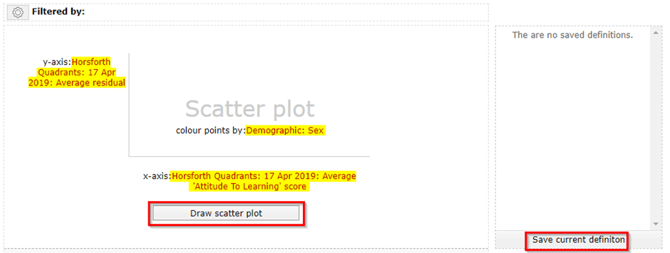
- Select the data to plot on the axis:
-
- Average residual on Y axis
-
- Average ATL/Effort on the X axis:
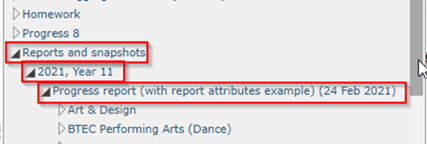
- Select ‘Reports and snapshots’
- Select the academic year
- Choose the report you wish to take the average effort score from
- Average ATL/Effort on the X axis:
-
-
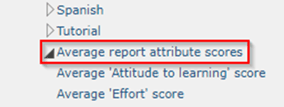
- Scroll to the bottom of the department list and select ‘Average report attribute scores’
-
-
-
- Select the attribute you wish to plot on the graph.
- I have selected to highlight the data by the sex attribute, but you may wish to select an alternative key group
-
- Click ‘Draw scatter plot’.
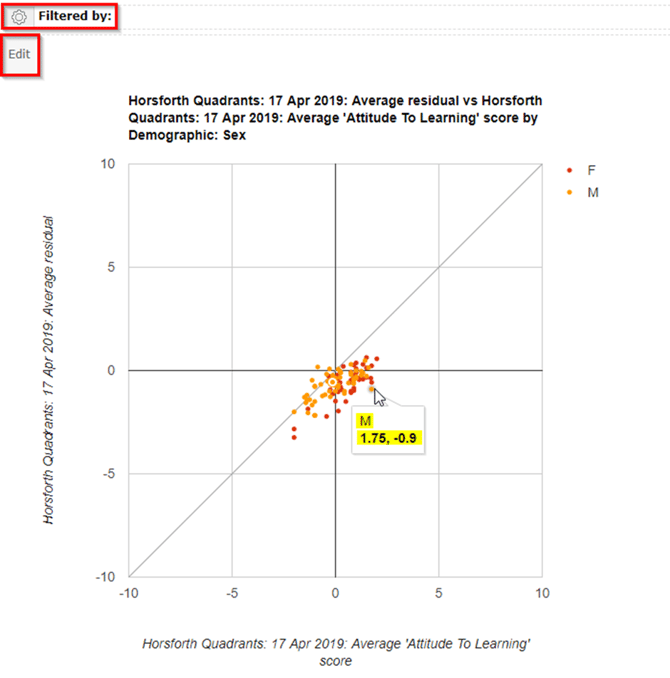
Hovering over the points will display a tool-tip with the values, clicking on the points will display the names of the pupil/pupils. You are then able to click on the names to visit the students page.
Clicking ‘edit’ returns you to the page where you select your axis allowing you to make changes.
Clicking the cog to the left of ‘filtered by’ allows you to select an attribute that you wish to filter on. For example, you may wish to only display the PP pupils.
You may use alternative systems to generate the quadrants, for example a programme provided by PiXL, or resources available via TES. In that case you may wish to upload the quadrants to a custom attribute and continue with the analysis outlined below.
Analysing statistics by the four Horsforth quadrants
Once you have identified which quadrants your students belong to you can then upload these values to a custom attribute as text and add the attribute to the corresponding set.
Further information is available via organisations such as PiXL for advice on suitable interventions.
Headline statistics
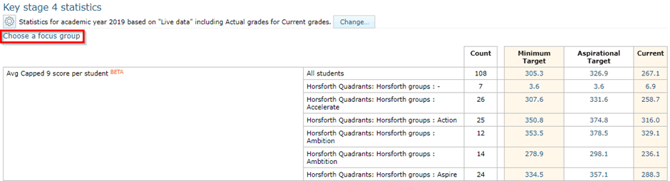
From the year group page, you are able to select ‘Focus group’ and then choose the Horsforth groups attribute from the detailed statistics page from clicking on the highlighted link below:

Subject ribbons
From the subject (or group) page you can add a new set of ribbons displaying group residuals and the percentage of students currently achieving/targeted a C grade for the Horsforth groups. You are then able to easily drill down into students from each quadrant that are below target to set different intervention.
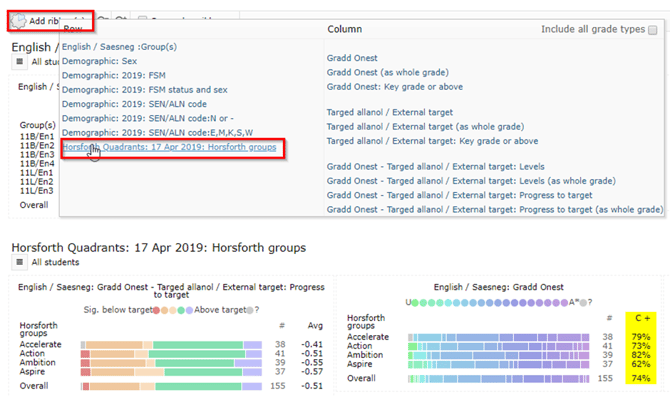
You may consider doing this at subject level, as there may be a difference in quadrants for students in English, Maths and Science. You can work to their strengths and use this as an incentive to pick up areas of weakness.