
- View residuals based on your custom residual schemes.
- Filter the students shown in the ribbons, e.g. to show disadvantaged students only.
- View a larger version of a set of ribbons, and view the underlying tabular data as counts or percentages of students.
- Download the underlying data as a CSV file.
- Open the students in a band in a data explorer.
- Drill down to look at students in a band.
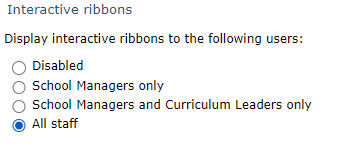
The visibility of the ribbons are controlled by the settings in Statistics and analysis setting which is available under the Curriculum menu:
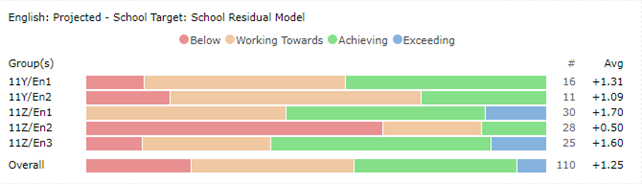
An example of a residual scheme ribbon
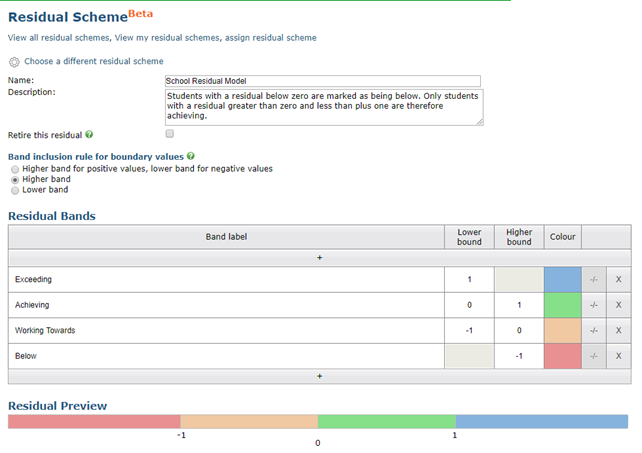
Having set up a custom residual scheme and assigning it, the labels and colours are then used in the enhanced ribbons.
Example custom residual scheme:
The ribbons on a subject page will look like this:
Adding ribbons for comparing focus groups
At the top of the enhanced ribbons there is a button that will allow you to pick from your focus groups to add ribbons for those groups of students:
It will present you with lists of focus groups to add additional rows, as well as additional grade types for adding more columns of ribbons:
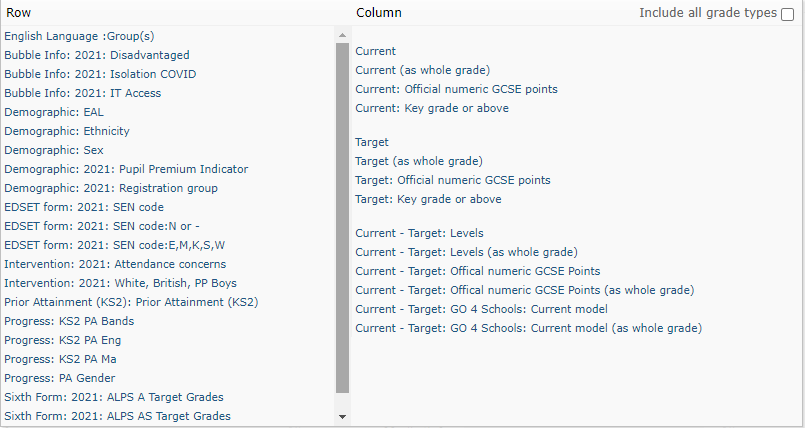
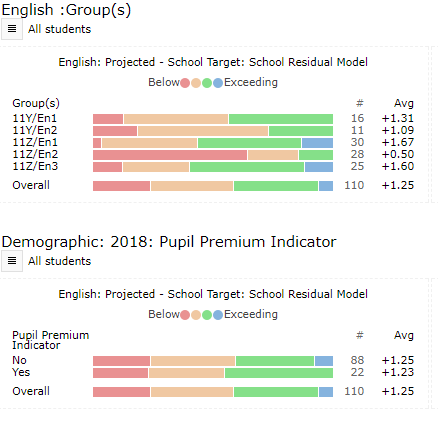
Selecting Pupil Premium Indicator for example gives you a separate row for just your PPI students:
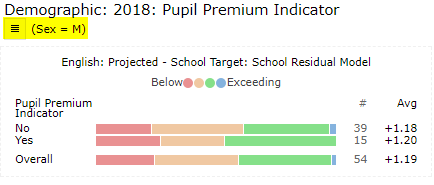
You can then further filter those students by selecting the All students button, so looking at PPI boys:
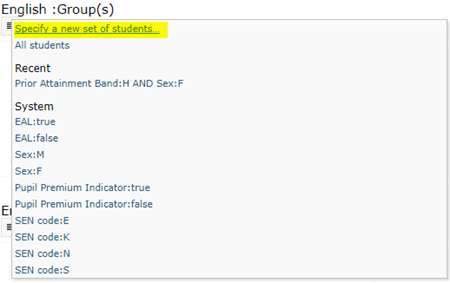
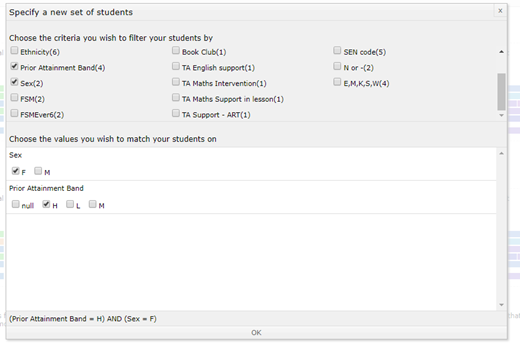
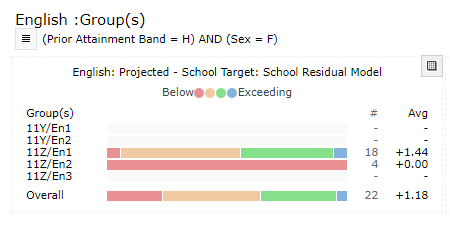
You are also able to filter by multiple categories by specifying a new set of students, and then selecting those values, below is filtering to show high attaining girls:
Exploring the data behind the ribbons
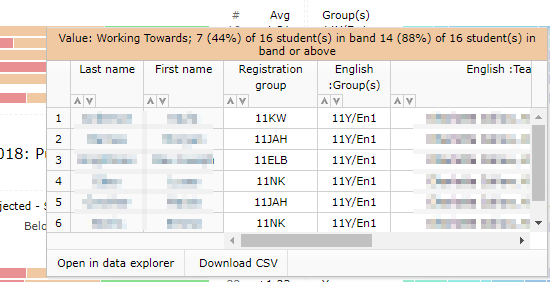
While the ribbons are interactive, you can click on a band and a table of the students making up the band will be displayed:
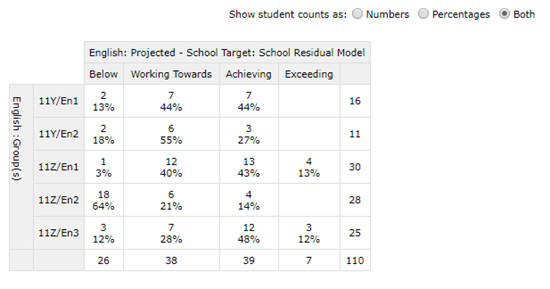
The ribbons are visual representations of data held in a table, to see the tabular data for all of the ribbons, click on the View ribbon data in detail or a table button, which will give you larger version of the ribbons, but also allow you to see the tabular data:
 You are also able to download the data in a CSV format, or open it in a data explorer, where you can add/remove columns, and create a postcard view:
