
Analysing Key Stage 5 data by focus groups
We are often asked by schools which focus groups they should use for Post 16 data analysis. This document aims to provide insight into how a school might analyse Key Stage 5 data in GO 4 Schools using specific focus groups. It doesn’t cover the mechanics of setting things up in detail – those are covered in the various user guides and videos (in the Help and Technical Support area in GO 4 Schools – most notably resources that focus on student attributes and student attribute sets). This document is not intended to be prescriptive. We recognise that all schools are different, and the patterns of use discussed below may not always be right for your school. To our knowledge, no school works exactly in the way described, but this document may be useful for understanding data in more depth using GO 4 Schools.
Groups to consider
Whilst this list is not exhaustive this hopefully will give you a good starting point to decide which groups you might use for your particular context.
Groups that will be covered in this area.
Most common
- Disadvantaged
- Bursary
- Ability Bands (to include ALPS Bands if using ALPS)
- Destinations
- Categories for retention
Other useful groups
- Year 11 feeder school
- Attendance concerns
- Intervention/mentoring
- Outlier group
For the 16-19 IDSR (Inspection data summary report) we have created a separate document that highlights specific groups in the report and demonstrates in-year analysis of these groups.
Analysing headline data by focus groups
By navigating to the Year 12/13 key statistics page (Year Groups>Year 13) there are two ways to view focus group sets against headline data.
- Looking at all focus groups associated with Post 16. You will be able to view all groups associated with Year 13 (or Year 12) as long as the attributes have values in them and they have been selected for “analysis of attainment data”.
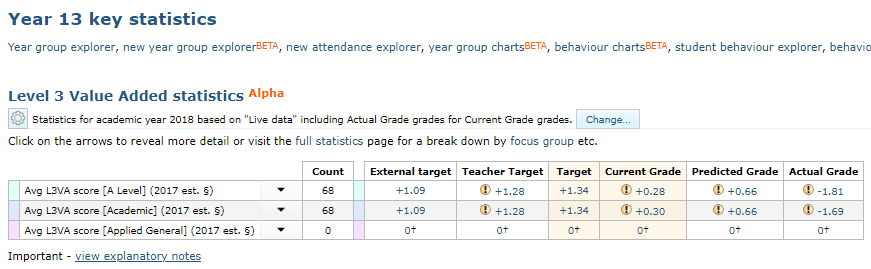
By selecting full statistics highlighted in blue this will take you to the full statistics page.

Clicking on show/hide focus groups in the image above will give you a list of all performance measures in GO 4 Schools against all your focus groups (see below).
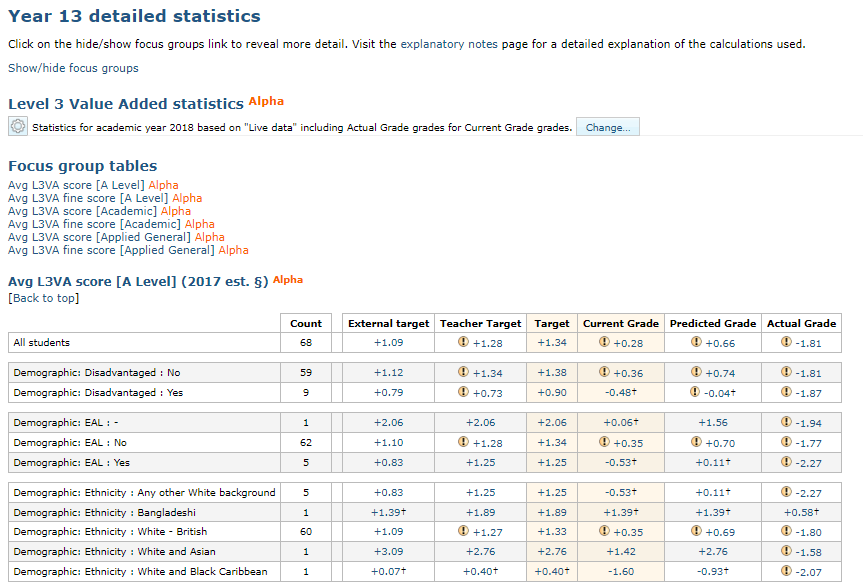
Note: The Demographic: EAL attribute has three values including one “-“. This is because there is one student who does not have a value. As this is a system attribute (an attribute that is pulled directly from your MIS) this should be corrected in your MIS and this will then be reflected in GO 4 Schools after the next feed (normally the following day).
Looking at a single focus group
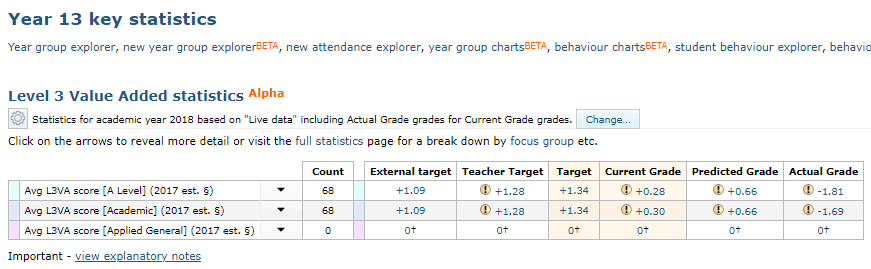
By selecting focus groups (highlighted in red), you will be given a list of attributes ordered by attribute sets:
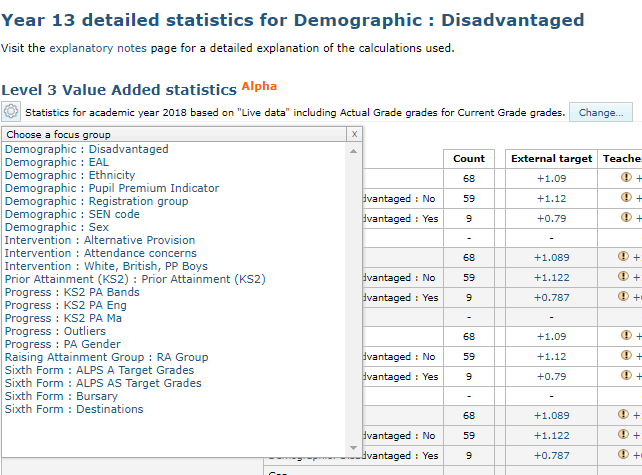
By selecting any of the attributes e.g. “Demographic: Disadvantaged” you will see the performance of this focus group against all the performance measures that GO 4 Schools provides (see next section).
It is worth noting here that any figure highlighted in blue can be clicked on and this will take you to an explorer view. This will give you a breakdown of individual student scores associated with that measure and allow you to drill down deeper into the data.
Disadvantaged/bursary
Disadvantaged students are those who were in receipt of pupil premium when they were in the last year of Key Stage 4 (excluding Service Pupil Premium students). Their performance in 16-18 headline measures is compared to non-disadvantaged students in state-funded schools and colleges nationally. For tracking purposes, it is important to check that you have an accurate list of students who are disadvantaged, schools often do not capture this information on entry if the student was not on roll at their school in year 11.
Following the instruction in the previous section this will produce a list of the performance indicator of the disadvantaged cohort against the whole cohort as well as those students that are not disadvantaged. We have selected below a sample of the tables that appear. You may want to investigate this page in more detail to look at the tables that will be important for your school.

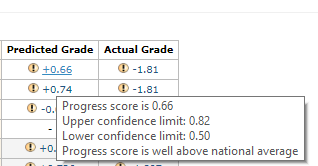
L3VA data is available for all three Level 3 cohorts (A Level, Academic and Applied General). By hovering on any of the figures in the table this will give you the overall progress score, the performance band (from the revised performance tables – see Appendix A of the Performance Measures report) and the confidence intervals. All our data for L3VA is based on the Ready Reckoner and you have the option to choose between which version you would like to use (in Manage>School>Statistics and Analysis settings).
Gap values
When scrolling down further you can see the entries against grade type by which an A*-B has been achieved. This is also showing a gap value. In the table below there are no students who are disadvantaged achieving an A*-B based on their current grade and this demonstrates a gap value of 27.5%.

N.B. When every student has one of two values in an attribute e.g. yes/no, red/blue a gap value will appear in the headline statistics when you are looking at a specific focus group.
Ability bands
Ability bands are key to the analysis of Key Stage 4 data but are not commonplace in sixth forms and colleges. Target setting software like ALPS provides bandings based on prior attainment ranges. Even if you do not use target setting software at Key Stage 5, ability bands based on your own criteria can be added in to GO 4 Schools to view performance against the key performance measures.
The schools that we work with that have used ability bands have found merit in this approach. This has meant that they have been able to see where performance at both year group and departmental level of particular prior attainment groups has been positive or in need of intervention. The L3VA tables below shows performance in each of the ALPS bands and also by school constructed prior attainment.


The 16-19 IDSR (Inspection data summary report) highlights different ability bands. This is something we expect many schools to track on in the future. We have produced a separate document for analysis of the 16-19 IDSR.
Destinations
Destinations data has been growing in importance and will continue to do so as highlighted in the DfE Statement of Intent 2018
“The government has been clear that we want to see students progressing to both university and higher level technical and vocational learning, including apprenticeships”.
The DfE Statement of Intent 2019 further highlighted that from January 2020
“we will introduce a new “Progression to Level 4 or higher” measure, to encourage schools and colleges to prepare their students for academic, technical and vocational study at level 4 and above. From January 2020 performance tables will show the percentage of Level 3 students from each school or college that continue to degrees, higher technical courses and higher apprenticeships as well as a score that shows whether this demonstrates good progress based on the students’ prior attainment and qualification type. The Higher Education breakdowns will be retained, and moved in to the new Level 4+ measure.
Whilst destinations data is published two years after a particular year group left the school, tracking prospective destinations over the two (or three years) in post 16 education can demonstrate the effort that it made in preparing students for post 18 life. Tracking these groups against assessment data can give a greater understanding of how groups of students with similar destinations are performing. For example, schools have often seen under performance by students who have been given unconditional offers by universities or have guaranteed employment or apprenticeship once they finish their 16-18 study.

Categories for retention
Retention is another key performance measure that schools are assessed on. By adding categories of retention into an attribute you can monitor the performance of students that are in an “at risk” group. This can help you to monitor students that are in danger of not completing the two years of their course. For example, you can see below that the five students in the “at risk” category have an average points score of 7 points in the applied general cohort statistics averaging a “U” grade compared to “no concern” students averaging a “Merit” grade.

Other groups often useful for the analysis of headline data
As with all interest groups, all of these groups may or may not be relevant to your school’s context.
1. Year 11 Feeder School
Schools which have a significant number of students who come from other schools into year 12 often track their feeder schools or simply have an internal/external student attribute. This supports understanding of how these groups of students perform.
Example A: By different schools

Example B: Internal students versus external students.

2. Attendance concerns
Many schools have challenges with groups of students with poor attendance. Academic research clearly points to the correlation between poor attendance and poor academic outcomes. By having an attendance concerns attribute, academic performance can be monitored for students in certain attendance bands.

3. Consortium sixth forms
Consortium sixth forms have students coming from other schools to take subjects, often as guest students. Guest students will not appear in headline data unless you select those students to be included in statistics. Guest students will still appear in subject statistics. For more information on including guest students click here.
If you choose to include guest students in your headline measures using an attribute to look at headline performance of students based at different schools can be beneficial.

4. Intervention/mentoring
Quantifying the improvement of both individual students and groups of students in intervention is important in demonstrating that the programmes you are employing for underachievement are working. We have created a yes/no attribute which highlights students who are on or who are not on a mentoring programme.
After navigating to the year 12 or year 13 key statistics page and then selecting focus groups (see page 4) in the top left hand corner and selecting your attribute then clicking “change” you can change back to a previous data snapshots.

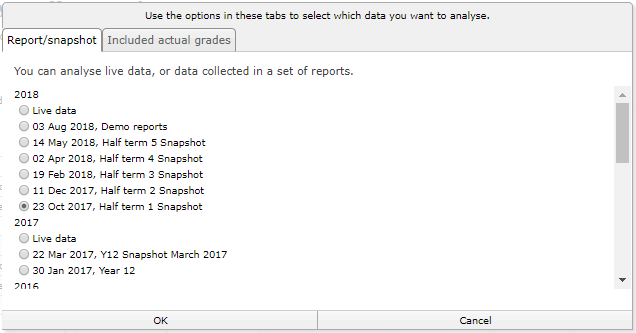
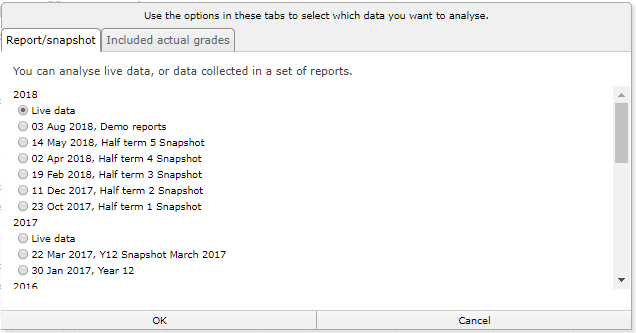
The data below demonstrates that there is a clear difference between when the group was highlighted on 22 October 2017 to the live data especially looking at the current grade for L3VA in the A level cohort.
Time Period 1 – 22nd October 2017

Time period 2 – Live data (July 2018)

5. Outlier group
As with key stage 4 having an outlier group or a story group – students with a story behind them - is important in understanding key stage 5 performance. This is often used to demonstrate groups of students who have underperformed due to exceptional circumstance e.g. family problems. Some schools will have a main outlier group with all students who have mitigating circumstances and separate groups such as attendance concerns (see above) and mental health problems.
Outliers can have a significant effect on your statistics as demonstrated below.
