
Introduction
The governor view allows school governors to instantly access a dashboard of contextual information and key performance indicators for their school. The data is drawn automatically from live data held in GO 4 Schools and presented in easy-to-view charts and tables. Access to secure, real-time information allows governors to work with the most up-to-date information, saving time and helping to improve outcomes by identifying and sharing best practice sooner.
Setup and access
Governor access is created and managed by the school, from within the main school site. Every user will need a governor account to be manually created by the school, even those users who already have access to the main School site.
Grades
The school will have a preferred progress grade and a preferred target grade used for tracking student data, which may vary for different year groups e.g. KS3 tracking on current grade vs end of year target, KS4 tracking on predicted grades vs end of KS4 target. The school will need to link their school specific grade names to the “Target” and “Progress” grade labels used for the governor site (this is done from the school site).
Data visibility
The school has control over which data is made visible on the governor site. Whilst the school can produce snapshot reports at multiple points throughout the year to send home to parents and/or for their own analysis purposes, it may not make sense for all these snapshots to be visible on the governor site.
Basic navigation
Logging in
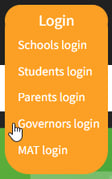 |
Once users are advised that their account has been created, they can use the link “Governors login” from the GO 4 Schools website. |
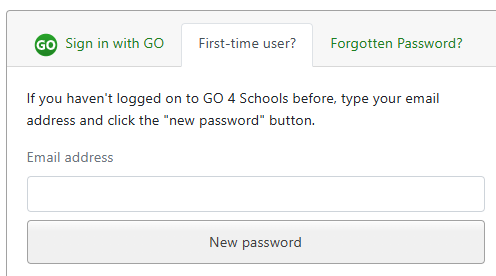 |
If the user has logged into any GO 4 Schools site before, they can use the same password to log in to the Governor's site. If they are new to GO 4 Schools, users can request a password in the “First time user?” section of the login page. |
School context table
The default data set is based on key focus groups and data from the Ofsted data dashboard including:
- Prior attainment of the cohort on entry for the previous key stage, where applicable
- Male vs Female
- SEND
- Disadvantaged/pupil premium
- EAL
 |
This data is drawn from ‘Student attributes’ in the main school site. Pupil premium, SEND, EAL and sex are all ‘system attributes’ extracted from the school MIS by the GO 4 Schools feed tool. Prior attainment and disadvantaged cohort data are drawn from ‘Special attributes’ which the school needs to upload into GO 4 Schools and can then be viewed in the governor view.
When selecting a year group by clicking one of the tabs across the top of the page, data relevant to that specific cohort will be shown, i.e. Year 7 to Year 11 displays KS2 prior attainment as this is relevant data for these year groups. Additional information is available via the links to the latest Ofsted report and the DfE comparison website. This ensures your current data can be viewed alongside previous official school data to support evidence of improvement or highlight where intervention is required.
Performance charts
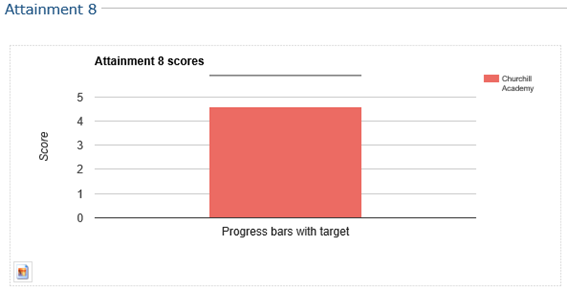 |
Easy-to-read bar charts covering key performance indicators allow you to easily see data at-a-glance. |
|
|
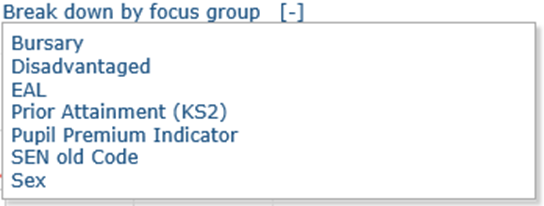
For each KPI chart, selecting ‘Break down by focus group’ directs the user to a new page for the source KPI showing the selected focus group. This enables users to easily drill down into information to review patterns or similarities in data for comparative purposes. |
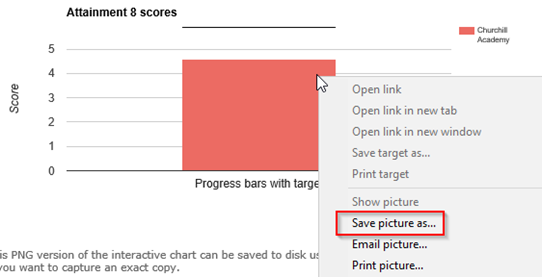 |
The image icon below the chart will generate a PNG version of the chart for you. If you right click on the image produced, you can save it locally. This may be useful if you wish to share it with other people, incorporate it into a report or add it to a presentation. |
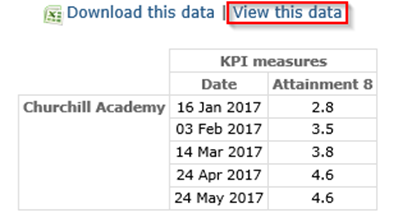 |
Further options are available to view the data on screen in a table below the chart, or to download the data in CSV format which may be useful if you are looking to analyse the data yourself in Excel. |
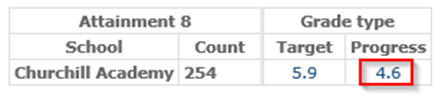 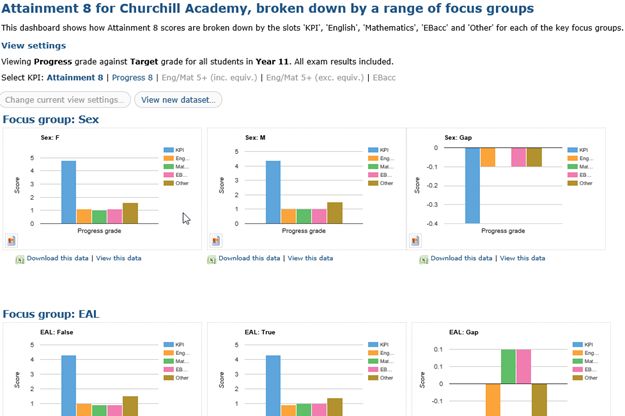 |
Some of the values in the data tables are links that will take you to a further breakdown of the data by focus group. To return to the previous dataset or choose a new dataset, click on the “View new dataset” button at the top of the page. |
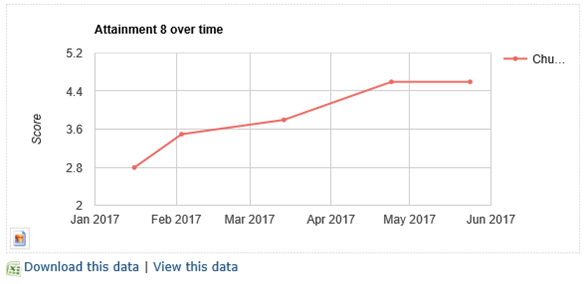 |
Trend charts based on report snapshots allow a view of the change in data over time and the rate of change. |
Summary data table
This table at the bottom of the governor site shows a year group summary across the full range of key performance indicators displayed in a table.
 |
Views and settings
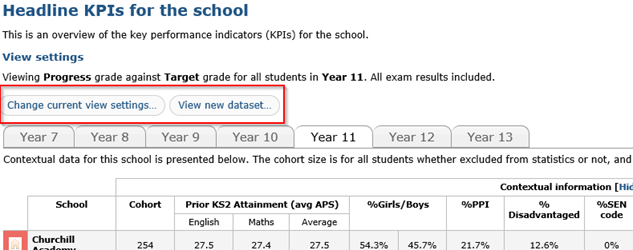 |
Users can select their preferred view by clicking on the ‘View new dataset’ button or manipulate the page by clicking on ‘Change current view settings’. These buttons and the settings chosen are fixed at the top of the page to allow the user to alter their selection at any time. |
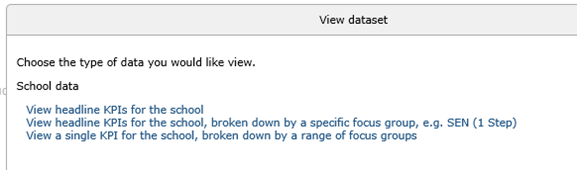 |
View new dataset… You can choose to see the overall data, data broken down by a specific focus group, or broken down by a range of focus groups. |
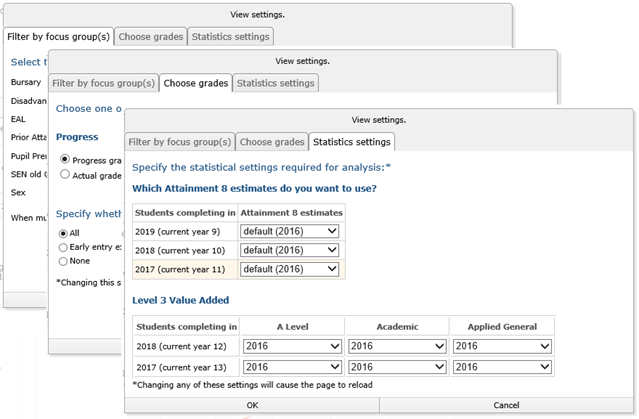 |
Change current view settings… Three tabs are available – Filter by focus group(s) Be aware that when multiple attributes are chosen (e.g. Pupil Premium = Y, Sex = M) stats will be returned only for students who meet ALL the chosen criteria. Choose grades Choose to use the progress and target grades set for trust use by the school or choose Actual grades instead. These will be official exam results, so particularly useful after results day in August. Statistics settings The default estimates will be the most recent official set of estimates for the cohort. However, users can choose their own settings for their active browser session. |