
GO 4 Schools can display many sets of statistical information about year groups, departments, subjects, and groups such as:
- The distribution of target grades, i.e. what percentage of students have a target of 9, 8, etc.
- The distribution of residuals, i.e. how many students are one grade above their target (a residual of +1) or below target (which is a negative residual).
- Interactive ribbons are available on subject and group pages enabling you to view residuals, grade distribution and percentage of students on or above the key grade broken down by the groups you have set for the analysis of attainment data, and then filterable.
Non-interactive ribbons
If enabled in your school, the non-interactive ribbons will appear on your year/subject/group pages, clicking the Choose ribbons... link on these pages give you a variety of options:
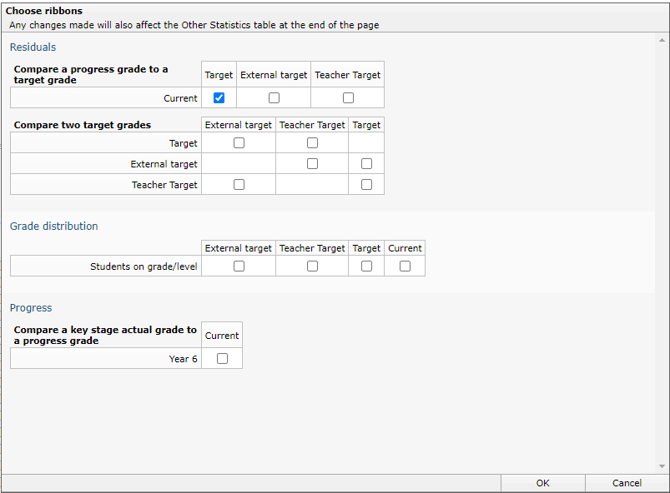 Please note: Your school manager can control whether you see the Progress section, as there is no way to measure progress with scaled scores/numeric GCSE grades, most English schools should have this disabled. Welsh schools still use sublevels and A-G GCSE grades, so they may have it enabled.
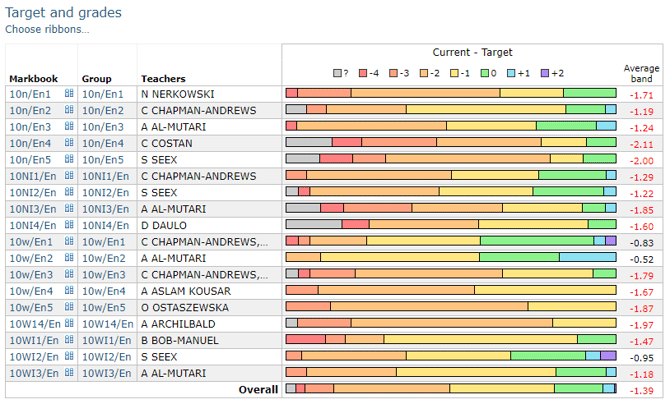
The default ribbons that are displayed are your preferred target/progress grade residual band ribbons. These ribbons show the difference between the two grades, and then put the students into their bands. The Average band is calculated by multiplying the count of students by the band value, and then dividing by the overall student count.
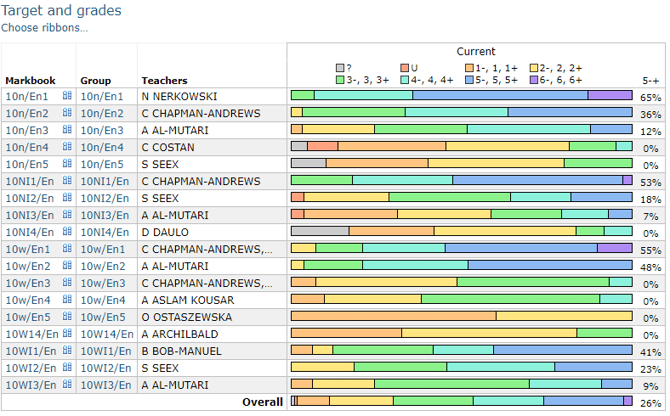
 Ribbons showing the distribution of current grades group together fine grades in the same band (5-,5,5+) and in the end column provides the percentage of students achieving grade 5 (5- if using fine grades) or above for each group, followed by the overall subject figures.
You can also display multiple sets of ribbons on a page, allowing you to compare the distribution of current grades and target grades for groups in a subject, while also looking at the residual band data.
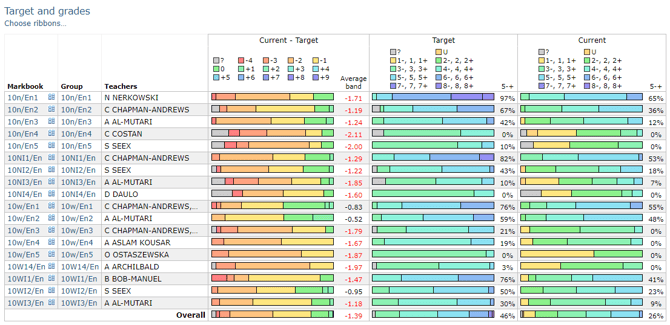 Different sets of data may be offered for display on different pages due to data available for display. For instance, residuals can't be summarised unless GO 4 Schools knows target and current grades. If the necessary data can't be found, GO 4 Schools will choose the next best thing based on the data that is available.
Enhanced subject/group ribbons
The interactive ribbons are displayed on each subject page and will use the residual scheme settings (colouring, grade value tolerances and band label) selected by your school. The ribbons are an excellent way to identify patterns between different classes and identify which students are below target and require further support to achieve their target. The ribbons also enable you to quickly and clearly compare the performance of key focus groups at the subject level using either interactive tables or ribbons. A complete write up on how to use them is here.