
The 16-19 IDSR (Inspection Data Summary Report) produced by OFSTED is a key document used in understanding Key Stage 5 performance in schools. This document is the only document OFSTED uses to access Post 16 outcomes.
In January 2020 schools were able to access the new- style IDSR based on schools 2019 data. Whilst no individual school data was published for academic years 2020 or 2021 it is important for schools to recognise the headline figures, generated sentences and trends that the report shows. Schools use GO 4 Schools to provide a narrative about their performance since the last report demonstrating key findings from the report have been addressed and are being monitored.
Schools can download their school 16-19 IDSR from DfE sign in.
The new 16-19 document has significantly slimmed down the data analysis in the IDSR. The DfE guide on the new IDSR can be found here.
Schools should use the IDSR in conjunction with the DfE Measures Report to understand key areas of strength and weakness in their Post 16 provision. A sample DfE Measures Report with commentary can be found here.
The latest anonymised version of the 16-19 section of the IDSR (for 2019 results and beyond) can be found here.
A number of guidance documents are available detailing the information found in the DfE Measures report and these are linked below:
- Guidance for L3VA Prior Attainment values when using 2019 estimates
- Level 3 Value Added Statistics
- Best 3 A Levels
- Analysing by APS Points per Entry
- KS5 Level 2 English and Maths Progress Measures
- Key Stage 5 Level 3 Maths Attainment
- Analysing Key Stage 5 data by focus groups
As mentioned, the 16-19 IDSR has been significantly reduced since the last edition. There is very little focus on interest groups in the IDSR when previously there was a strong focus on prior attainment and disadvantaged. HOWEVER, the interest groups will appear in the statements at the front of the IDSR so it is important to track on these groups during the academic year.
This document is a guide as to how you might track in year data against the data measures outlined in the 16-19 elements of the IDSR. This gives you a narrative to show that in year data demonstrates the improvement of outcomes for areas that have been highlighted on the first page of the 16-19 IDSR or to support sustained performance or improvement in key measures.
Important points to consider:
- The DfE guidance for the 16-19 IDSR outlines that the new IDSR has been designed to:
- reduce the time spent preparing for an inspection
- provide interpretation of the data for inspectors
- minimise the focus on small groups that distract the conversation away from meeting the needs of all learners
- The 16-19 IDSR focuses on 3-year trends. Previous years’ data in GO 4 Schools can be viewed if you had a subscription to GO 4 Schools in those particular years.
Aspects in the IDSR that you can track in GO 4 Schools:
- Level 3 value added for A level and Applied general cohorts - GO 4 Schools provides substantial statistics at Year group and Subject level.
- Level 3 Value Added by Subject
- Retention - This figure is dependent on a number of contributing factors that are often beyond the school’s control. Whilst GO 4 schools does not track the official measures you can track students who are “at risk” of retention. This is covered in the Retention section.
- Level 2 English and Maths progress scores - Whilst not directly mapping to the measure, GO 4 Schools provides useful in year tracking. We have produced a document going into further detail here
- Attainment - GO 4 Schools provides APS per entry, Best 3 A Levels and a number of other attainment cohort statistics.
- Destinations - Whilst not providing data on which destination outcomes have been “sustained” GO 4 Schools can provide options to look at the academic performance of students in prospective post-18 categories.
Aspects of the 16-19 IDSR that you cannot track in GO 4 Schools at present:
- Tech Level and Level 2 completion & attainment - Work has been planned for this measure but is not available in GO 4 Schools at this current time.
- Proportion studying DfE-approved L3 vocational qualifications: applied general and tech level - Work has been planned for this measure but is not available in GO 4 Schools at this current time.
- Funding allocation - GO 4 Schools does not record information about funding allocation.
If you are interested in finding out more our Education Services team consultants run courses on understanding 6th form data throughout the year, more information can be found from the CPD section of our website.
Learner context (Page 2 of the sample IDSR)
The first page of the 16-19 section of the IDSR provides information on the learner context. This highlights what % of the learners at your institution are included in the IDSR which indicates the weight it should have in assessing provider performance.
The first page also shows the funding allocation for 16-19 programmes as a proportion of the school’s overall funding allocation.
The last part of the first page shows the entry by qualification type cohort.
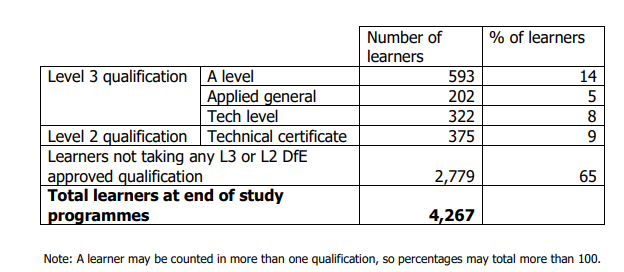
GO 4 Schools does provide the number of learners in each Level 3 cohort and there are plans also to display the Level 2 learners as well.
It is worth noting that GO 4 Schools will count the current students in your 16-19 provision in a particular cohort. The IDSR summary for a school will often contain “add-back” students, students who have left your school before completing the key stage that they were originally assigned to. These students are included in your results if they have not fulfilled the requirements of being included in another school/college IDSR. Information on add back students can be found in the 16-18 accountability measures technical guide.
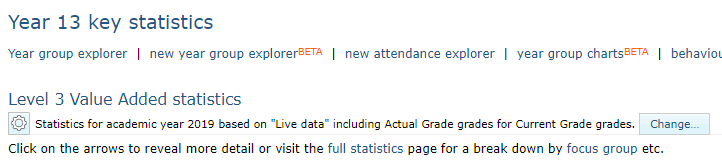
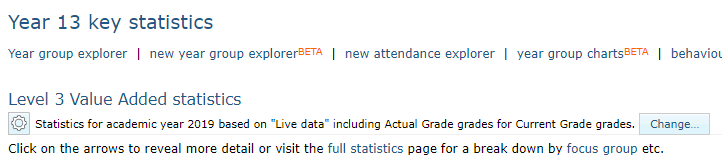
If you have entered the prior attainment values for Level 3 Value Added (L3VA) into GO 4 Schools you will see this information in the key statistics page (Year groups>Year 13). This will show the number of students in the A Level and the Applied General Cohort (as well as the academic cohort – see image below). If you need help finding and/or getting the prior attainment values into GO 4 Schools, support can be found in the document Guidance for L3VA Baselining when using 2019 estimates and beyond.

The number of students in the Tech Level cohort is not displayed on the Key statistics page. However, this information could be found by clicking on a grade in the tech level table as shown below in red, which will open an explorer. Filtering by total number of entries will display a list of all the students who are in the Tech Level cohort.
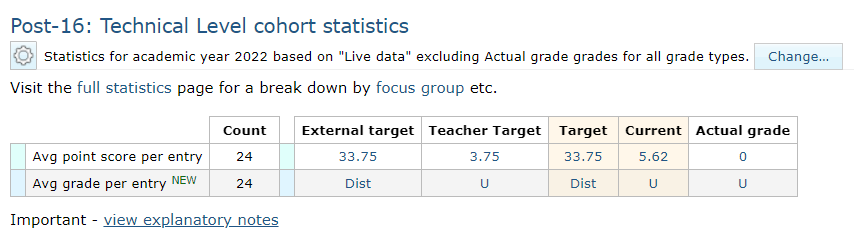
GO 4 Schools does not at this time provide % of learners in each study area or the proportion of students studying approved L3 vocational courses (applied general and tech level courses).
Areas of interest from the 16-19 IDSR (Pages 3 and 4 of the sample IDSR)
The second and third page of the 16-19 IDSR highlights “Areas of interest” rather than “Areas to investigate” in the previous iteration of the 16-19 IDSR. These will reflect the key areas to consider based on your data and can vary in number. Statements are positive or negative; this is to direct schools to plan to improve negative areas whilst sustaining the areas which are highlighted as positive.
The ‘areas of interest’ in the IDSR are sentences providing inspectors with interpretation of a provider’s historical data. A sentence may be ‘triggered’ by high or low performance, either across 2 years or in the latest year.
A sentence shown in grey may also appear when the school’s data is not high or low, for example, if progress scores are not statistically significant, to show the data has been analysed but the data is not of interest.
The statements are made on the following:
- Level 3 value added
- Level 3 value added by subject
- Completion and attainment
- English and mathematics progress
- Attainment
- Retention
- Destinations
- Learner groups
The statements should be used as a starting point to look at the data in GO 4 Schools.
It is important for schools not only to understand the statements that have been added to their IDSR but also the statements that have not been added. Understanding this means key interest groups can be tracked in GO 4 Schools to ensure that they are performing in line with other groups at the school.
A list of example sentences provided can be seen here.
It is worth noting that the example list is not a comprehensive list and the example in the sample IDSR (below) is one sentence that highlights interest in prior attainment groups (a Learner group).
“The value-added score was significantly below the national average and in the lowest 20% for A levels in both 2018 and 2019 for learners with prior attainment grades 4–6”
In the previous IDSR prior attainment group performance could be seen. In the current IDSR this is only highlighted if it is significantly positive or negative. This is why we suggest that categories like prior attainment and disadvantaged are always tracked on (see next section).
Learner context (page 5 of the sample IDSR)
GO 4 Schools contains a significant amount of the information that is needed for you to create an understanding of your learner context. The key categories to track on this page are:
- Disadvantaged students - This is the only group in this table that is used with regards to the data measures in the IDSR and the DfE Measures Report. Disadvantaged learners are held in a Special attribute that needs to be filled in by the school. “Disadvantaged students” are those who were in receipt of pupil premium funding when they were in the last year of KS4. Their performance in the 16-18 headline measures is compared to non-disadvantaged students in state-funded schools and colleges nationally.
- Prior attainment - Although there is no prior attainment displayed against the key measures in the IDSR (as there was in the previous IDSR) as stated in the previous section performance in these bands can be highlighted in the statements. The prior attainment bands highlighted on this page of the Sample IDSR are for illustrative purposes and are not used with regard to analytics in the IDSR. The bands used in this IDSR are highlighted below.
How to track on the categories above and other key categories (some of which are highlighted below) will be explored through this document.
The first table “Learner characteristics (end of KS4)” contains familiar groupings that are regularly used to analyse Key Stage 4 data.
English as an additional language (EAL) and SEN code are visible in GO 4 Schools as system attributes drawn directly from your MIS. Ethnicity is a new category for the latest IDSR. Ethnicity is also a system attribute (taken directly from your MIS).
Page 5 also details learners without English and Maths at grade 4 or both. This is to provide context primarily for the English and Maths progress measure but also for the wider context of your 6th form (highlighted on page 14 of this document).
We know that some schools have not gathered all the information on the students who have entered the school in Year 12. These students are often called “External” students. A custom attribute could be set up for these students in order to track their progress. These students tend to have an effect on the reliability of the data being tracked in year so it is worth checking that all data from students who arrived in Year 12 is up to date in GO 4 Schools. For working out prior attainment values for these students help can be found in the document “Guidance for L3VA Prior Attainment values when using 2019 estimates and beyond”. This is located here.
Other more context driven groups such as “Previous School” for students who have entered your school at the start of year 12 can be set up as custom attributes and then can also be used to analyse the data against all the key data measures in GO 4 Schools.
Information on setting up attributes can be found here.
For more information on analysing Key Stage 5 headline data by focus groups in GO 4 Schools click here.
Creating learner groups for use in GO 4 Schools
The learner groups highlighted below will be used to show how to explore deeper the contents of the IDSR.
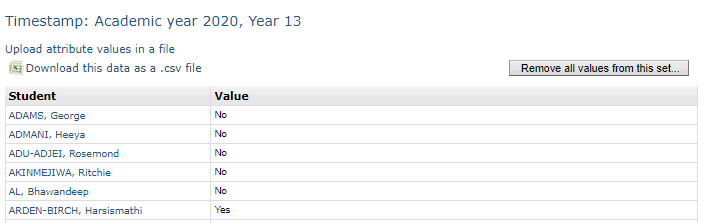
The Disadvantaged group of learners can be filled out using a “special attribute”. This is available in manage>students attributes>student attributes.

Every student should have a value. Attributes that have only two values (with no missing data) will display a “gap” value.
Prior attainment in terms of learner context is presented in two ways. Firstly, to show the breakdown of students at the school. This is shown to demonstrate to the reader the context of the student body’s prior attainment.
Context prior attainment bands:
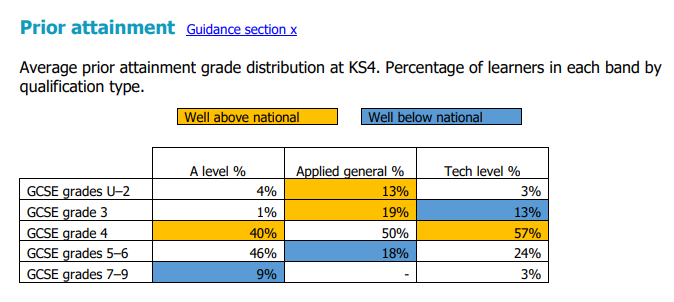
The criteria for the bands above is not shown in the supporting notes for the sample IDSR.
Schools should be aware of their own distribution especially as the Attainment measures in the IDSR no longer have any prior attainment bands. For example, a school cannot be reasonably expected to get into the first or second quintile in terms of APS points per entry performance when they have a Well above national proportion of students at GCSE grade 4 prior attainment and well below at 7-9.
Prior attainment bands used for sentence generation:
The prior attainment bands detailed below are used to generate statements about the school and can be used for under or over performance.
e.g. “The value-added score was significantly below the national average and in the lowest 20% for A levels in both 2018 and 2019 for learners with prior attainment grades 4–6”
It is therefore worthwhile to track on these bands to present a narrative on both past and current data. This is also useful if looking to use the 3 band model of prior attainment we regularly see at Key Stage 4 (HPA, MPA, LPA).
|
GCSE grade group |
Average points score boundaries |
|
7–9 |
=<6.25 and above |
|
4–6 |
=<3.5–<6.25 |
|
3 and under |
0–<3.5 |
To create these bands in GO 4 Schools you will need to download all of your prior attainment values from the special attribute Prior Attainment (KS4) (A Level Cohort). If using for the Applied General cohort we recommend using the Applied General Prior Attainment (KS4) (Applied General Cohort).
Original Attribute Sheet
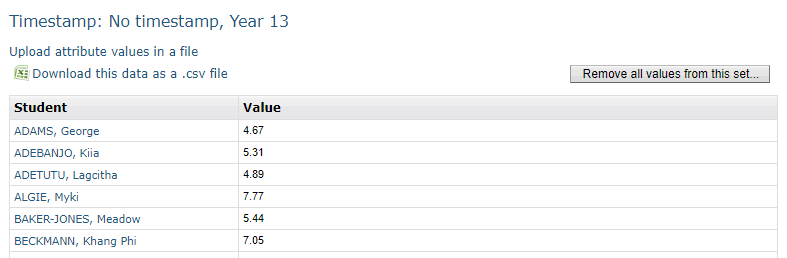
You then need to create a new text attribute (suggested) IDSR A Level Key Stage 5 PA band. Then add values displayed in the previous table.
New attribute sheet
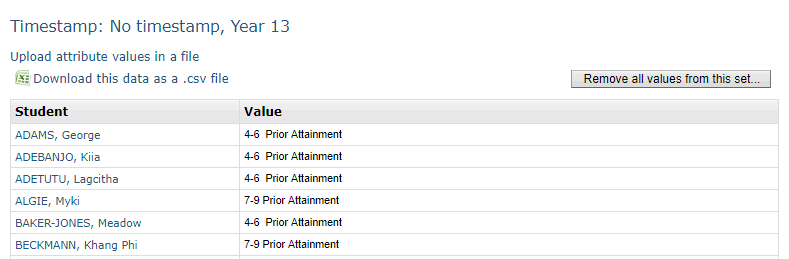
To be able to see these groups in the charts (and in headline measures) we must allocate them to a student attribute set. To learn how to do this there is a section in the school manager’s guide called Managing student attribute sets.
Once we have the new attribute(s) in place we will be able to look at the following in year data for the important key measures below using the PA interest groups (see page 13 of this document):
- A level and AS Level Value Added (these will be together rather than separate as shown in the IDSR)
- The Applied General Value Added score
- The attainment measures (A Levels APS, Best 3 A levels APS, A Level AAB%, Applied General APS, Tech Level APS).
Trends over time for level 3 study programmes (page 6 of the sample IDSR)
The trends over time data measures display Value Added (L3VA). L3VA is calculated from a student’s prior attainment at Keys Stage 4. For more information on student prior attainment and how to add the values for students into GO 4 Schools (and thus to be able to generate L3VA values) click here.
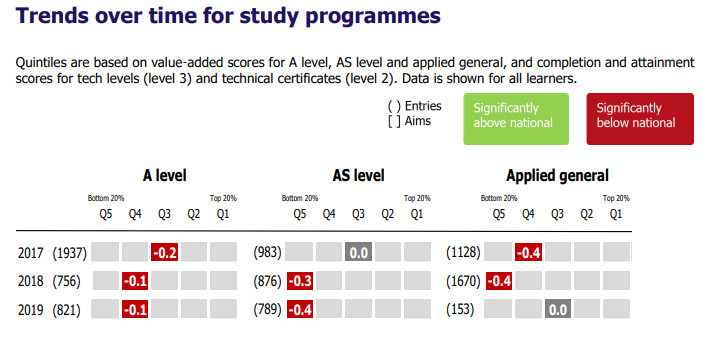
For in year tracking the data in GO 4 Schools is shown as A Level (which includes AS levels where appropriate), Academic and Applied General. This format is in line with the Measures report which schools receive from the DfE. A sample measures report (created by GO 4 Schools) is available here. By clicking on any of the figures in the table below this will give you individual scores for all of your students.
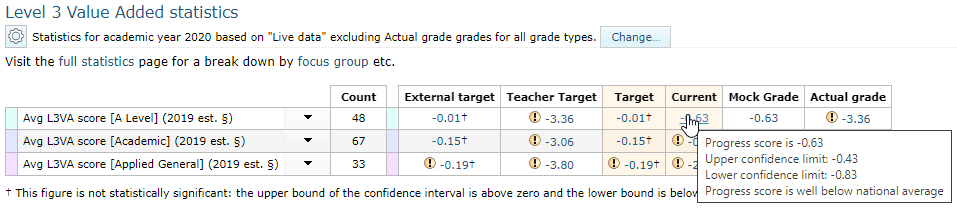
Whilst not being able to exactly replicate the national quintiles from the previous academic year GO 4 Schools does display the 5 DfE bands and confidence intervals (see above) that are used to assess the national measures and are displayed on the compare school performance website. These bands can be viewed here. The bottom two bands map directly to the statistically significantly below description, whilst the top two bands map directly to the Statistically significantly above.
Confidence intervals are calculated on all the value-added scores and these are used to calculate the statistical significance.
Statistically significantly below the national average is defined as when the value-added score is below 0 and the upper end of the 95% confidence interval is below 0. DfE bands “Below average” and “Well below average”.
Statistically significantly above the national average is defined as when the value-added score is above 0 and the lower end of the 95% confidence interval is above 0. DfE bands “Well above average” and “Above average”.
As of writing we have plans to display whether values are significantly above or significantly below national at cohort and subject level. We also have plans to display Tech Levels and Technical certificates completion and attainment scores.
Analysing L3VA by key learner group
The key learner groups that were created on page 8 can be used to monitor in year progress of these groups with regard to L3VA. Level 3 attainment by prior attainment at Key Stage 4 can be accessed in year through GO 4 Schools if the IDSR prior attainment bands have been set up and attached to an Attribute set as highlighted on page 9 (in the example below the Attribute set is called “Sixth Form”). The data below can be accessed via Year groups>Year 12 or 13> Focus groups and then choosing a focus group “IDSR A Level Key Stage 5 PA band”.
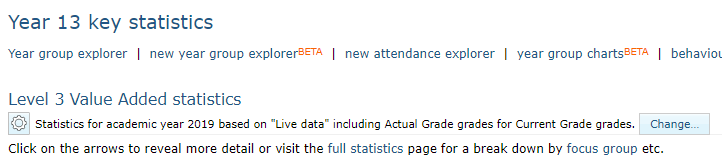
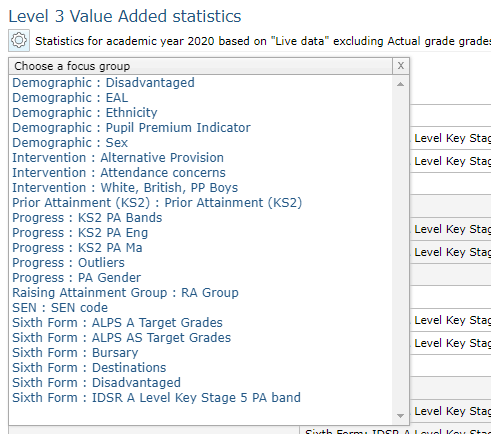
At the top of the page you will find the following table. There should also be a table for the Applied General cohort if you have Applied General students at your school. You will notice that there are only two bands displayed. In common with many schools there are no students in the A Level cohort who have an average prior attainment score of 3 and under.

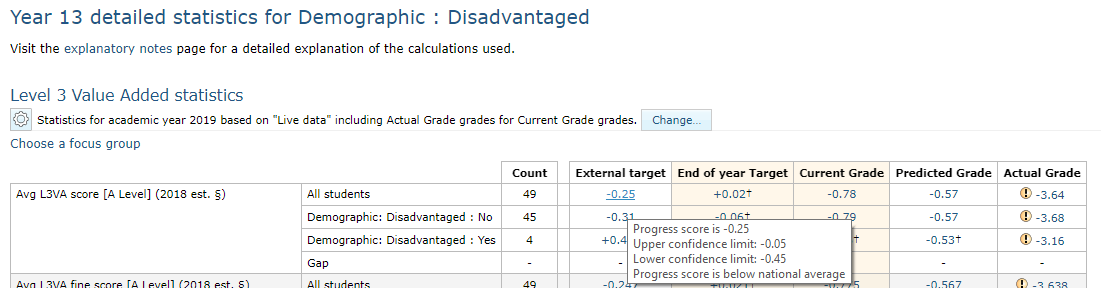
GO 4 Schools can also display the disadvantaged data for A Level (including AS) for disadvantaged students if the “Disadvantaged” special attribute is filled out as referenced on page 8 (e.g. disadvantaged). This can also display the Applied General cohort data too.
Level 2 English and Maths progress (page 7 of the sample IDSR)
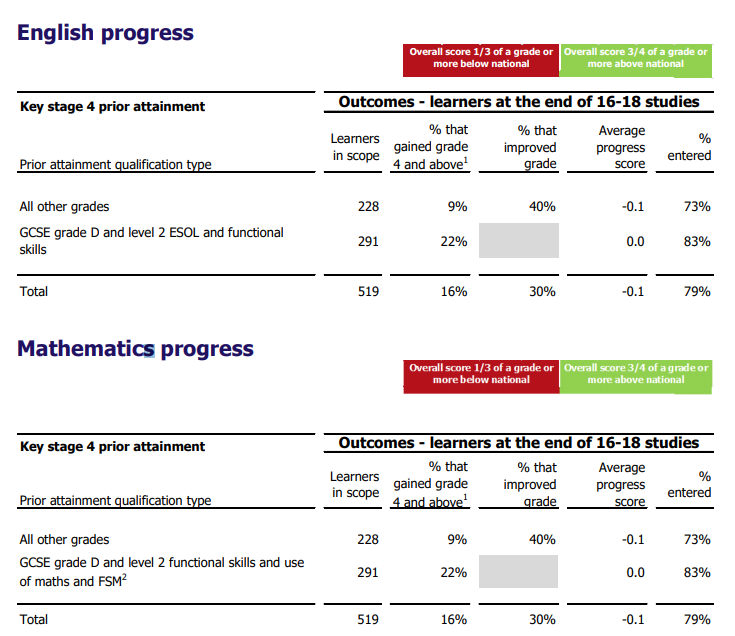
Whilst not being able to produce the English and Maths progress stats directly we have produced a document to support tracking for these two measures. To view this document click here.
Retention (page 8 of the sample IDSR)
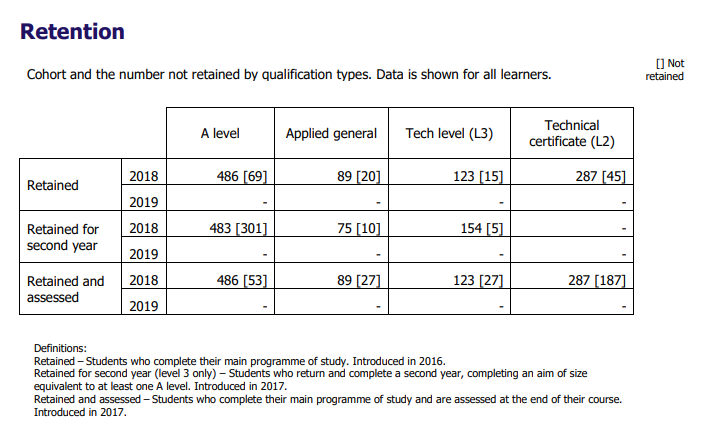
Retention is a difficult statistic for any school to work out before the official data is issued. Students may leave your school, attend another school and complete their studies successfully. On the other hand, they may not complete the requirements of being retained in their next school and thus be included in your school’s statistics as not being retained.
We encourage schools to track students that are at risk of not being retained.
For more information on analysing Key Stage 5 headline data by focus group including retention in GO 4 Schools click here. The document “Analysing Key Stage 5 Headline Data by Focus Groups” has a section on retention.
Attainment (page 8 of the IDSR)
Attainment is an area of the IDSR that has been dramatically reduced.
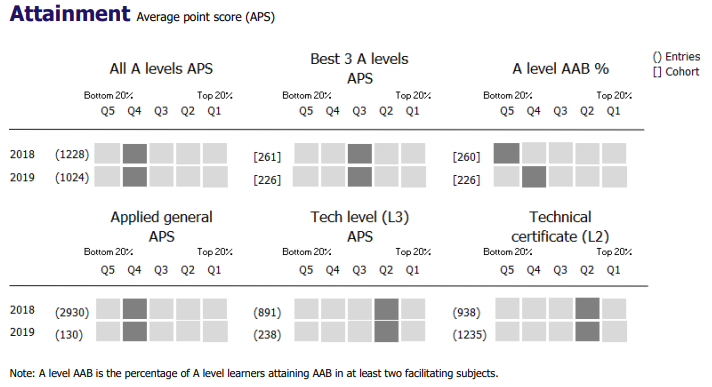
There is no display of Average grade or Average APS points per student displayed for each of the cohorts. There is also no judgement by ability bands. These were all visible in the previous iteration of the IDSR.
As stated previously, this page can give the reader a false view of school performance. If the school has students of generally lower prior attainment then it should not be expected that they appear in the first quintile with regard to attainment. Other schools will have students with higher prior attainment and therefore significantly more chance of their students achieving the top grades.
Level 3 attainment by prior attainment at Key Stage 4 can be accessed in year through GO 4 Schools if the IDSR prior attainment bands have been set up and attached to an Attribute set as highlighted on page 9 (in the case below the Attribute set is called “Sixth Form”).
This data can be accessed via Year groups>Year 12 or 13> Focus groups and then choosing a focus group “IDSR A Level Key Stage 5 PA band” if this has been set up as shown on page 11.
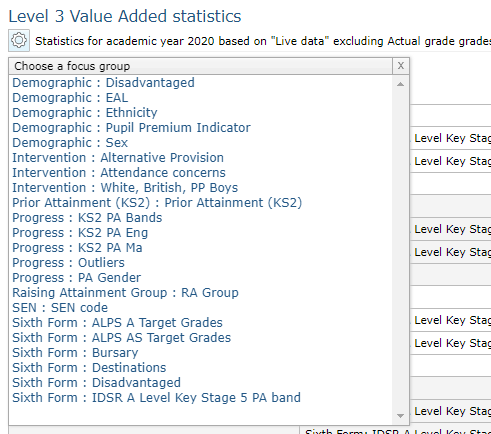
By scrolling through the page you will find the following tables
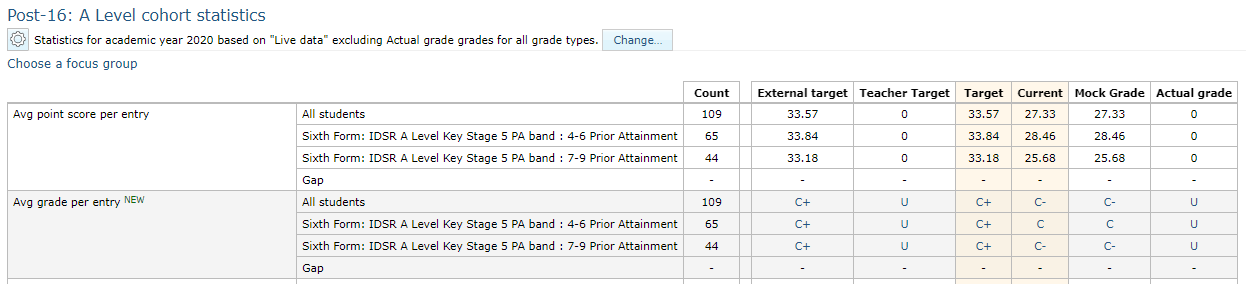

Attainment can also be displayed for the Applied General and Tech Level cohorts. If you have a significant sized Applied General cohort we recommend that you create a Prior Attainment band attribute using the same methodology as for the A Level prior attainment bands shown on page 11.
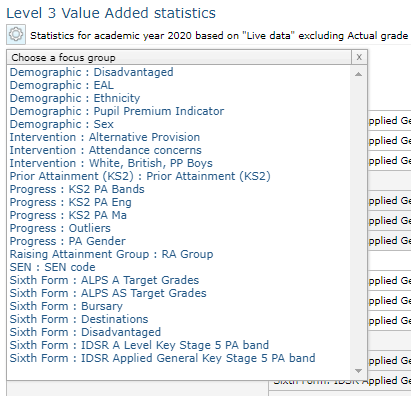
In the image above we have added the IDSR prior attainment bands. The tables below now show attainment scores for students in the three bands.
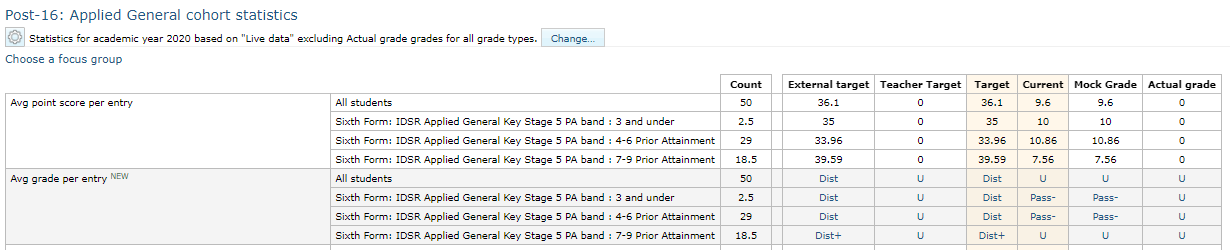
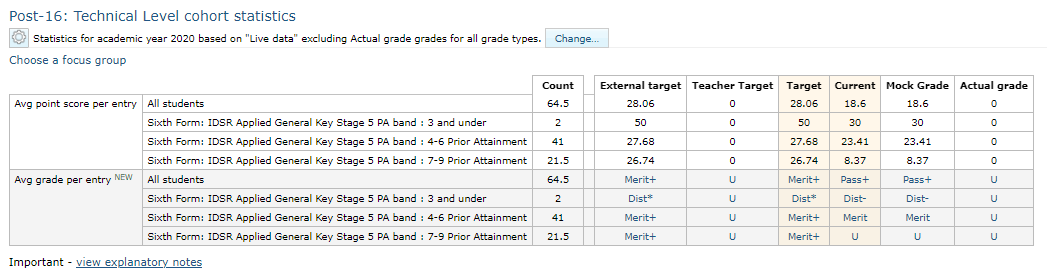
As with all GO 4 Schools tables you can find the individual student data that makes up a statistic by clicking on any of the scores highlighted in blue.
GO 4 Schools does not display 16-19 IDSR quintile ranking as of writing.
Destinations (page 9 of the sample IDSR)
Destinations data provides the destination of students who have entered at least one level 3 qualification at your school.
Destinations data is reported on two years after a year group has left the school and is collected at the end of the academic year after they have left the school.
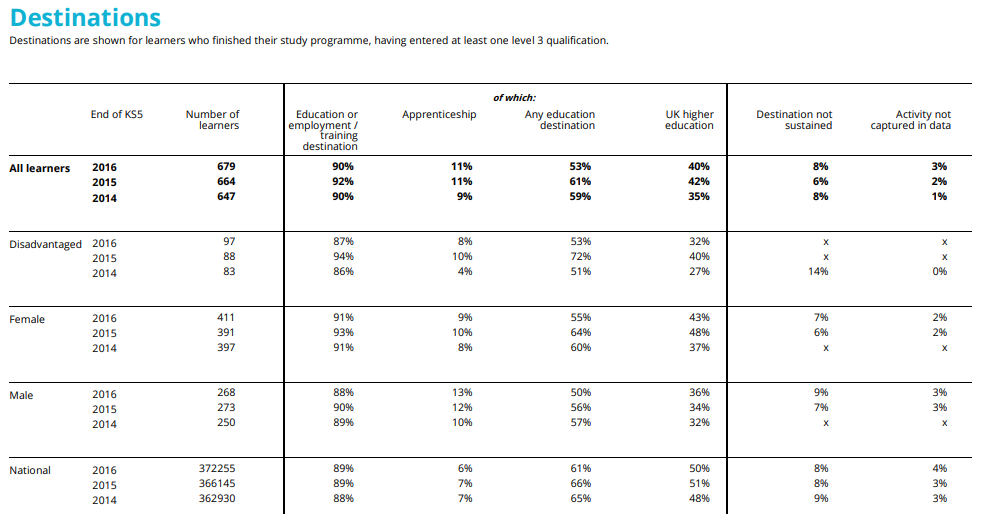
Schools often find destinations data difficult to track. As with retention we encourage schools to track destination data in year with categories that are suitable to their particular context.
For more information on analysing Key Stage 5 headline data by focus group including destinations in GO 4 Schools click here. There is a section on Destinations within this document.
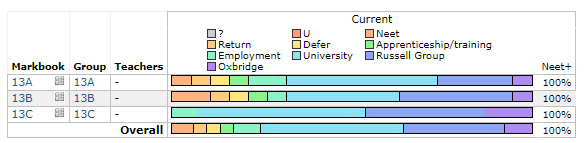
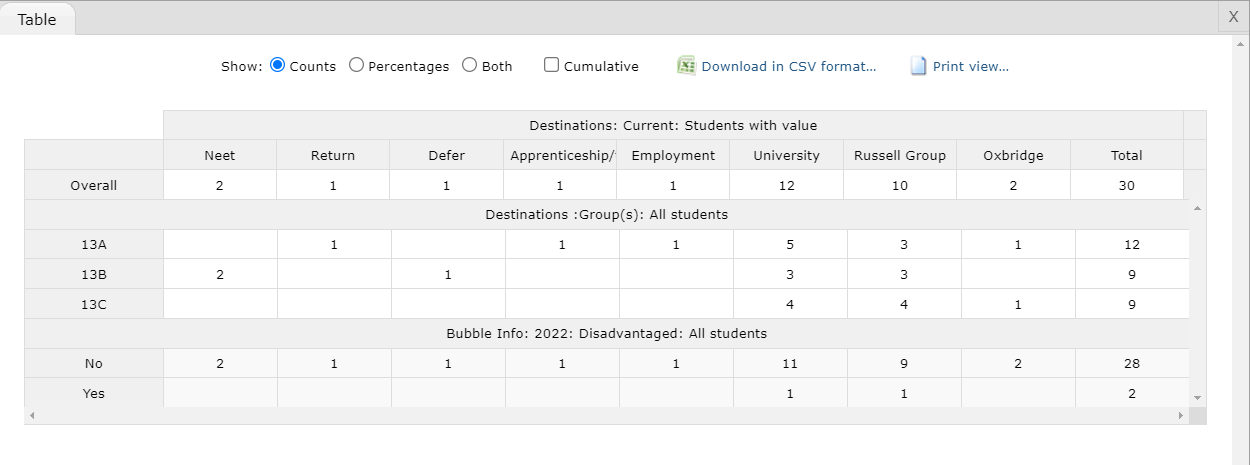
A destinations markbook has been set up on our demo site to display continuing data with regard to Year 12 and Year 13 Destinations e.g. University, Apprenticeship, Oxbridge. To view this sample markbook, log into the demo.go4schools.com website using your normal login information and browse to Departments>SAMPLES>Year 13 Destinations. This markbook’s structure can be copied to your school using a template markbook. A useful summary on predicted destination outcomes can be seen on the subject page with the ability to select a band and view the students.
Level 3 Value Added by subject page 10 of the sample IDSR)
This area has been drastically slimmed down compared to the previous edition of the IDSR where L3VA scores and confidence intervals were presented for each subject. As with the overall cohort scores on page 6 of the sample IDSR, subjects are highlighted if they are “Significantly below” and “Significantly above” the national average. 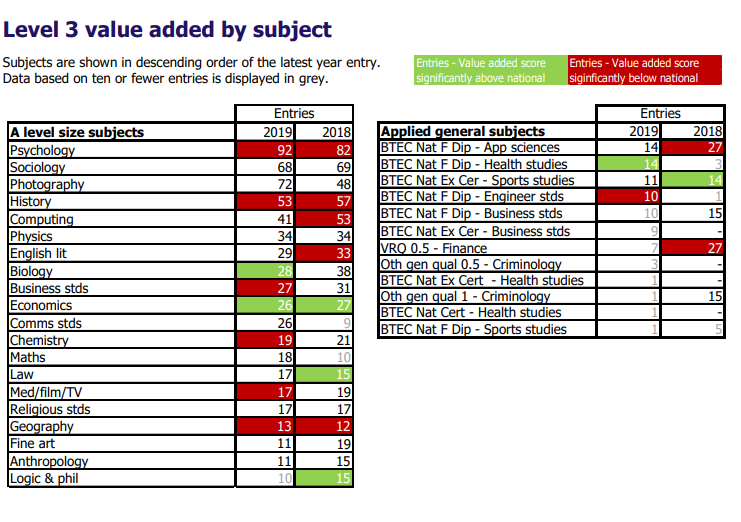
In GO 4 Schools you can view L3VA scores for all subjects (which we split into the A Level, Academic and Applied General cohorts). This will also show you the confidence intervals and one of the 5 DfE progress bands. We have plans to show whether departmental scores are significantly above or below average in colour, but currently they can be worked out using the following.
Statistically significantly below the national average is defined as when the value-added score is below 0 and the upper end of the 95% confidence interval is below 0. “Below average” and “Well below average” DfE progress bands.
Statistically significantly above the national average is defined as when the value-added score is above 0 and the lower end of the 95% confidence interval is above 0. DfE bands “Well above average” and “Above average” DfE progress bands.
The images below can be accessed via Year groups>Year 12 or 13> Full Statistics and then scrolling past the cohort statistics tables.
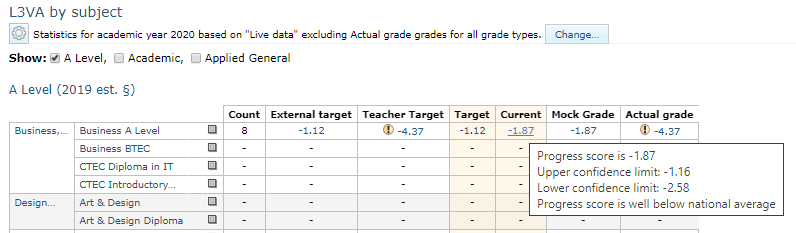
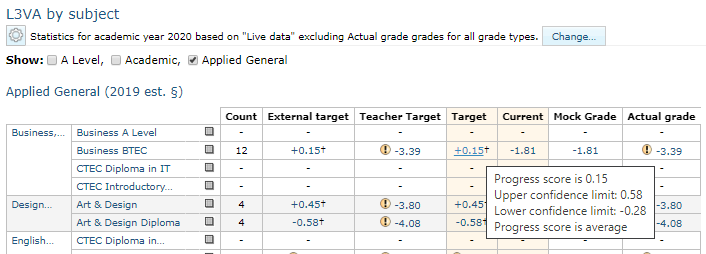
We believe that tracking on the L3VA performance of a subject is fundamental to analysing whether a department is performing and can be used to track departments which the IDSR highlighted in the previous year as underperforming. This can be used as a narrative to demonstrate improving performance and to intervene with departments where necessary.
It is always worth remembering that L3VA scores are created using the previous year’s national outcomes for particular subjects which is going to be an appropriate benchmark by which to judge current performance (especially considering the recent stability in courses schools have offered over the last year).
By clicking on any blue number in the table you will be able to see any student score for the subject.