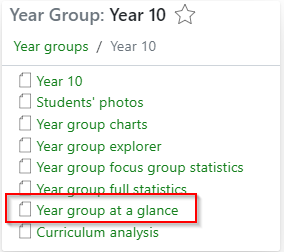
When using the new menus the at a glance page is available via links at the top of the year group page, as well as in the pathfinder menu:
This page aims to give you an overview of contextual information, key statistics, attendance, behaviour, as well as the Residual Progress Indicator (RPI)at KS4 for each department. Most sections can be viewed in an expanded view, as well as a focused view, which allows the viewing/exporting of the underlying data. There are also options to copy chart images and print. Finally, links to relevant pages on the site for viewing the data in full are available from the More options button.
Contextual Information
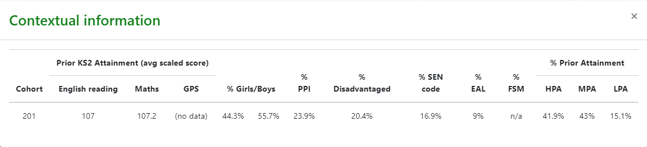
By clicking the icon at the top of the page you can see average prior attainment values, as well as key student attributes for the cohort:
Targets and Progress
The first section of the page is a view of your main target and progress grade residuals ordered in descending order. This view is based on the Enhanced ribbons, but will only display your main target and progress grades as set on the Grade and residual settings page.
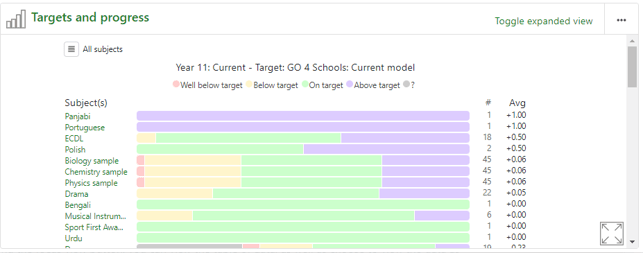
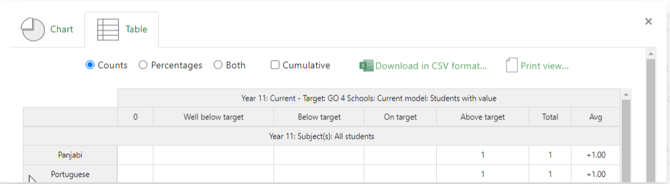
When clicking the focus view button  , you can view the table of data, as well as choose to view the data as counts/percentages/both, as well as cumulatively:
Attendance
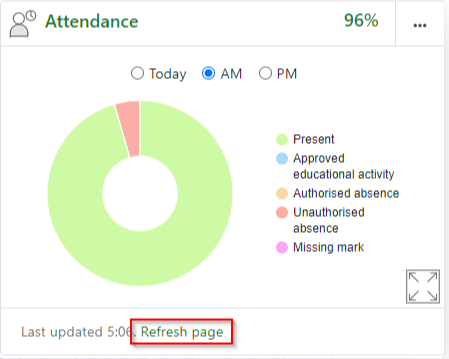
Next to the targets and progress is an overview of the daily attendance figure for the year group. What displays here differs by attendance tier. For tier 2/3 schools, this will use live data, for tier 1 schools it will update during the day as attendance feeds are processed. For non-attendance schools no data will show. By default it will load the attendance including both AM and PM sessions, but you can change this to view just AM/PM with the radio buttons, there is also an option to refresh the page at the bottom:
By clicking on the chart, you can view a list of students for each value:
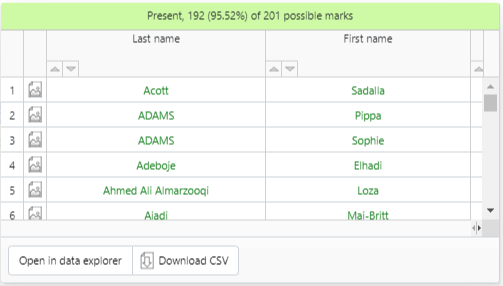
The focus view for attendance also provides the ability to view the underlying figures, export the data, and copy the chart image for use elsewhere:

Key statistics
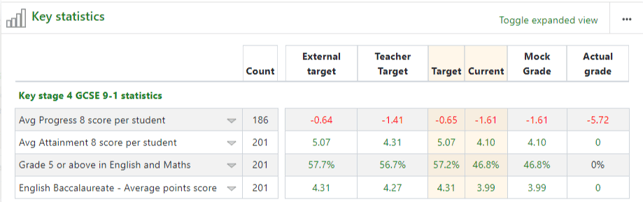
In this section is a quick view of key statistics for the year group, depending on whether official qualifications or internal grading schemes are in use. For each statistic shown, you can expand the rows. There is no underlying data available for this section, but each statistic will lead to a year group explorer view of the data.
Behaviour
The behaviour section shows the the points/counts of behaviour events by day/week, with a total at the top that changes based on whether you are viewing the last five days or current term:
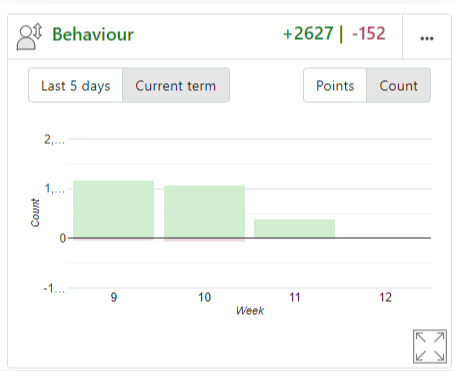
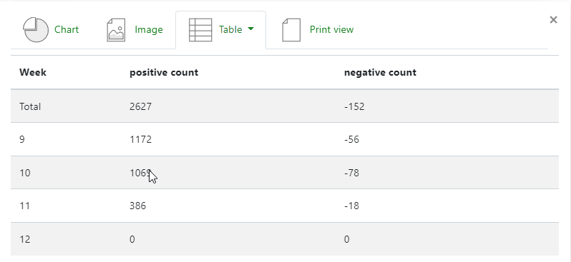
The focussed view on behaviour will allow you view the rolling term weekly totals:
Residual Progress Indication (RPI)
The residual progress indicator is a value that is calculated by looking at student entries and points, relative to other subjects that they study. Note this only displays for subjects using GCSE or equivalent qualifications using numeric points.
| Subject | Grade | Numeric Points | Entries |
| English Literature | 7 | 7 | 1 |
| English Language | 6 | 6 | 1 |
| Maths | 5 | 5 | 1 |
| Biology | 6 | 6 | 1 |
| Chemistry | 5 | 5 | 1 |
| Physics | 6 | 6 | 1 |
| History | 9 | 9 | 1 |
| French | 5 | 5 | 1 |
| Total | 49 | 8 |
Using the above student, the student's value for English literature would be calculated as below:
7 - (49-7)/(8-1)
7 - (42/7)
7 - 6
+1
Each subject's value is then calculated by averaging the student values for the subject.
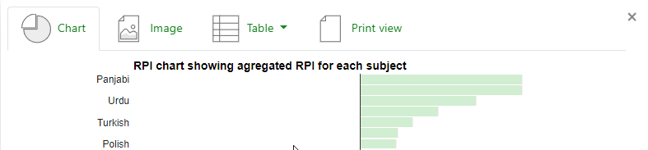
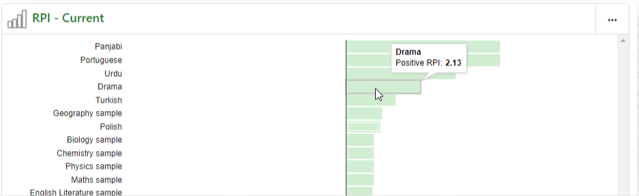
The chart will display the RPI for your main progress grade, and by hovering over a bar, you can see the numerical value:
As with the other sections on the page, the focus button will allow for the exporting of the values, as well as printing/copying the chart: