
This guidance document is intended to support school leaders (at all levels) with the analysis of GCSE and vocational results using GO 4 Schools. It outlines where key headline information can be viewed and how to drill down into key focus group analysis at headline, subject and individual class level (determined by the data and settings present in your student attributes).
Year group level analysis
GO 4 Schools supports leaders by providing a headline table on the year group page displaying the following measures:
- Capped 9
- L1 and L2 threshold
- L2 inclusive threshold (including the interim measure where Welsh or English literature qualifications can contribute towards the literacy component)
- Analysis of core subjects
[Tip] You can quickly navigate to the Year 11 'At a glance' page by clicking your school logo on the top left of the webpage.
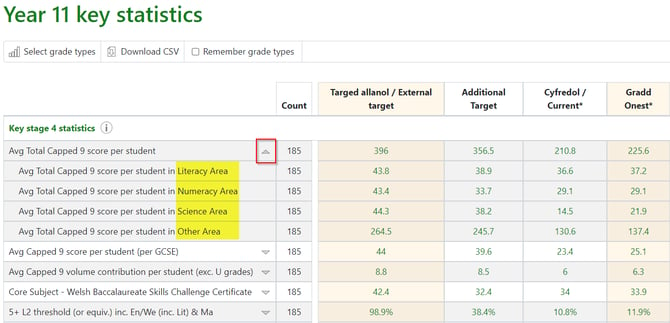
The key statistics table is a simple way of comparing current, predicted, target and actual grades side by side (honouring your columns enabled via Curriculum > Grade & residual settings). This allows you to consider variation between current, predicted and actual grades, and explore the reasons for the variation. Clicking in to the tile will allow you to view a more detailed version of the table, and some of the headline measures can be expanded to provide a further breakdown (by clicking the arrow adjacent to the measure), for example the Capped 9 can be opened up to look at the APS achieved in each of the four contributing components (as seen in the image below):
The following sections contain a brief summary for each of the table rows, but you may find it beneficial to read the explanatory notes, which are linked at the top of the table and updated regularly:
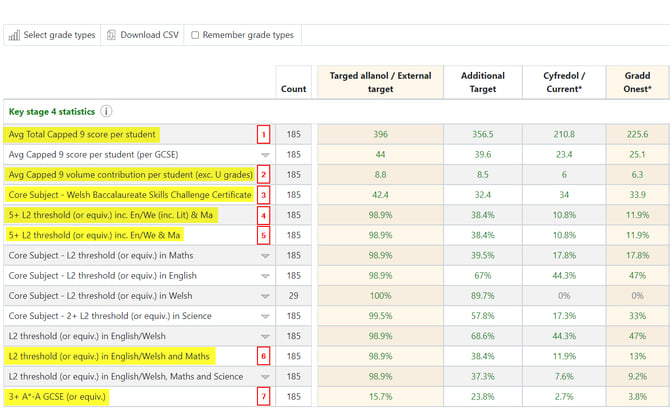
1. Avg Total Capped 9 score per student
This drop-down will display the APS for each element of the Capped 9, and also the numeracy, literacy and science APS values which make up elements of the interim performance measures.
2. Avg Capped 9 volume contribution per student (exc. U grades)’
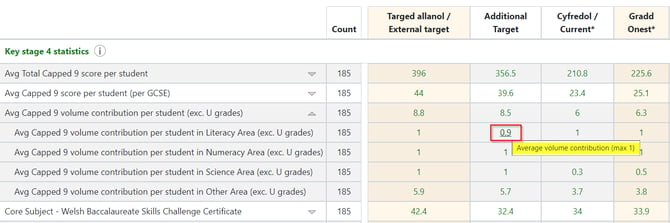
This drop-down is particularly useful in determining whether students are studying enough subjects to satisfy all components of the Capped 9. Hovering over the numbers displays a tooltip informing you of the maximum subjects for that area (i.e. the example below is showing that the maximum subjects in the literacy are is 1). For further information on tracking the Capped 9 in GO 4 Schools, please refer to the guidance document entitled Calculating the Capped 9 – post 2018.
Clicking on the numbers will take you to a data explorer where you are able to filter and add additional fields for further analysis. Further detail of data explorers is provided later in this document
Key questions:
- Are your students studying enough subjects to satisfy all components of the capped 9?
- Is there a wider discussion to be had about the curriculum offer and its appropriateness for various groups of students within your cohort?
3. Core subject – Welsh Baccalaureate Skills Challenge Certificate
This row displays the APS for the Skills Challenge Certificate, which is another one of the interim performance measures.
4. 5+ L2 threshold (or equiv.) inc. En/We (inc. Lit) & Ma
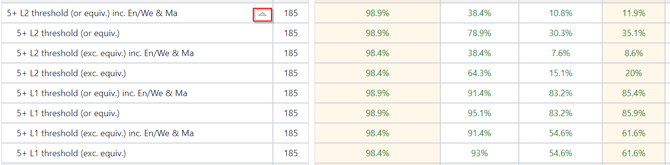
This updated legacy performance measure to include English literature in the literacy element of the L2 inclusive is also available for the following:

5. 5+ L2 threshold (or equiv.) inc. En & Ma
This legacy performance measure of the L2 and L1 inclusive is available for the following (equivalences are any vocational qualifications delivered alongside GCSEs):
6. L2 threshold (or equiv.) in English/Welsh and Maths
This section of the table allows you to track the match-up between English/Welsh and maths at both L2 and L1.
Clicking on the number will take you to a list of the students falling into that category (e.g. names of the students who are on a C in maths, but not in English). This is particularly useful when planning targeted intervention.

7. 3+ A*-A GCSE (or equiv.)
Enables you to monitor the percentage of students achieving 1+, 3+ and 5+ GCSEs (or equivalents):
 Key question:
- Is there a significant gap between the targets for you’re A*-A measures and the current grades being achieved, i.e. are your more able students on track?
Further key questions:
- Do you have students on track to achieve a grade C (or above) in at least one core subject and three other GCSEs (or qualifying vocational courses) who require additional support to achieve a C in the second core subject?
- Are you able to demonstrate the positive impact of these targeted interventions, i.e. is your match-up improving as a direct result of pupils attending them?
Attainment (performance measure analysis) over time
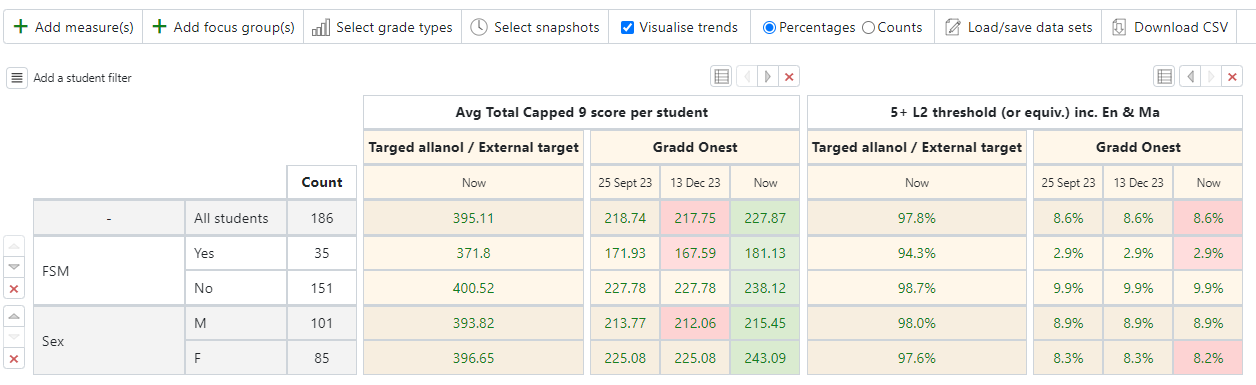
Guidance on carrying out analysis of performance measures over time, including the ability to break it down by key groups and see a gap analysis can be found here.
Key question:
- Can you demonstrate the impact of your LNF delivery by comparing literacy and numeracy grades (or APS) snapshotted at the start of the academic year with current grades?
Year group data explorers
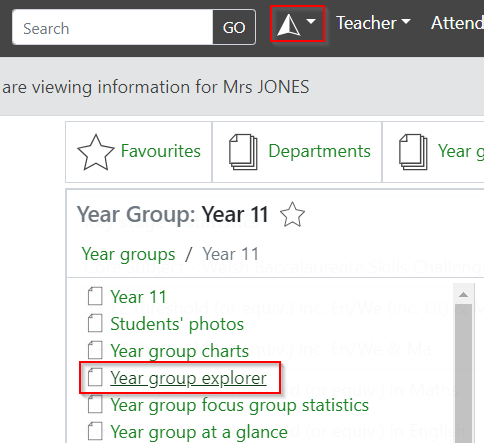
The data explorers can either be accessed via the link highlighted below, or by clicking on the numbers described in the preceding section.
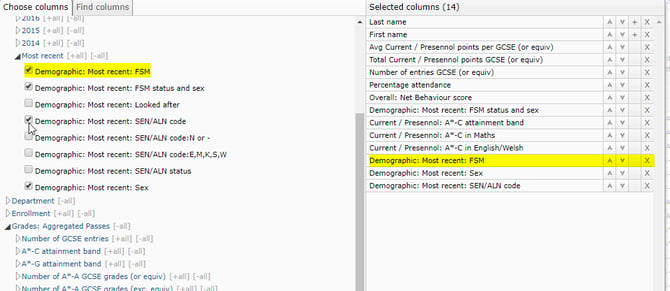
The explorer displays a default set of columns, but you can draw in additional fields that are applicable to the context of your school (and focus of analysis) and delete those that ae not required. This is accessible via Add/remove columns:

You can display any of the student attributes that you have marked for the analysis of attainment data, and that have been placed in an attribute set (please refer to the guidance document entitled student attributes).
The fields that you select from the left-hand side will appear on the right-hand side, and then in the explorer:
You are then able to filter by these key groups, and the displayed total/averages will be recalculated.
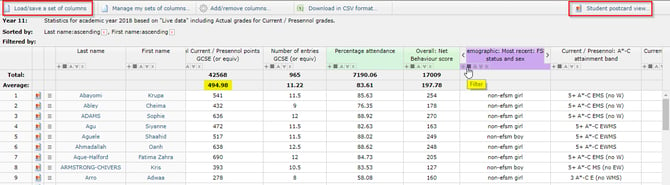
It is possible to save these columns, and share with others, via the ‘Load/save a set of columns’ link in the top left-hand corner of the page.
You can view this explorer as a student postcard by clicking the ‘Student postcard view’ link. This is particularly useful if you are maintaining a ‘war wall’.

A video introducing data explorers can be found here, and a guide on the GO 4 Schools pre-prepared column sets can be viewed here.
Key questions:
- Is there a gap in the capped 9 score for your FSM and non-FSM pupils? What interventions do you have in place, and are they having an impact?
- Is there a gap between the achievement of your male and female students? How are you closing the gap if there is one?
- Are you able to triangulate achievement with behaviour and attendance?
Subject data in year group explorers
Available nodes for each subject under Department > ‘Subject name’ include:
- Grades, grade percentage, APS points for all grade types in use.
- Residual band, points, levels comparing any progress grade to any target grade in use.
- Progress levels and points; if you have a baseline data uploaded.
Within each of the nodes are selections for all grade types in use.
Below shows the data explorer view sorted by number of entries and displaying the honest grade and residual label for English language and history.
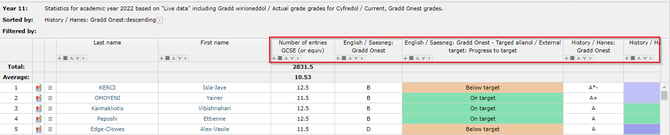
This view can be set up, saved and shared with other staff to include all subjects and will update as your live data changes.
Data for multiple subjects for different ‘snapshots’ throughout the year can also be compared by using the Reports and snapshots node:
Data can be viewed from any academic year and is then listed chronologically by each of the prepared reports.
Grade or residual data can be selected for each subject included in the snapshot at the time and the data can be selected as grades, percentages and/or points.
The example below displays English language grades over time:

If you select APS points for each of the snapshots, then the data explorer will display totals and averages at the top of the columns so average APS points over time can also be compared across subjects.

Analysing KS4 Curriculum in GO 4 Schools
This following guidance is intended to support school and subject leaders with the analysis of the KS4 curriculum results using GO 4 Schools. It outlines where subject level information can be viewed, compared and how to drill down into key focus group analysis at a wider curriculum and subject level. Data can be compared with national subject examination results published for the examination year from JCQ.
This will focus on comparative subject analysis across the school for a forensic view of school performance to validate curriculum decisions. Effective subject level analysis is crucial to driving successful school improvement. Each subject has the potential to positively influence student outcomes and therefore contribute to the success of the overall performance of the school.
National Focus Groups
The following key student focus groups have been identified as areas to investigate levels of achievement during inspection.
- FSM
- Sex
- ALN
One of the simplest ways to review the achievement of focus groups is by using the curriculum analysis interactive ribbons. These are available to view at year group level and subject level. Subject specific analysis information can be understood by reading the Analysing KS4 data by subject guide.
Subject comparative data
Schools need to compare performance across the curriculum to see where student performance has excelled or has been challenged. Key issues such as the type of student cohort, subject area teaching shortages, resources, allocated curriculum time can all impact on individual subject outcomes. Viewing all subjects together is an important aspect of analysis for all school leaders.
The analysis tools described can be used for in year tracking using your preferred progress grade. For exam results analysis, we recommend that you change the preferred progress grade to the Actual grade in grade settings once examination grades are uploaded.
Curriculum analysis ribbons
On the year group and subject pages, you will find enhanced ribbons for comparing subject performance and individual detailed subject performance respectively. The ribbons are grouped by two main types of data; school residual schemes, and by grade/points distributions.
Key features of the ribbons are options to:
- filter subjects in the display to remove non-curricular and non-exam-based subjects for the year group
- view residual ribbons by residual scheme or department for the year group
- view grade distribution ribbons by qualification type or department for the year group
- select any target or progress grade as a residual display
- select distribution by grades – whole and/or fine
- Select APS distribution
- filter ribbon selections by key focus groups
- View student level data interactively for each ribbon band
- View ribbon data in table form as counts, percentages, and cumulative data
- Download data tables as a csv.
The ribbons must be enabled by the school manager to be visible to users. Either school managers only, with curriculum leaders or all staff. This setting is in Curriculum > Statistics and analysis settings.
Year group enhanced ribbons
These can either be accessed via the 'Targets and progress' tile of the year group at a glance page, or via the 'Curriculum analysis' link in the pathfinder menu.
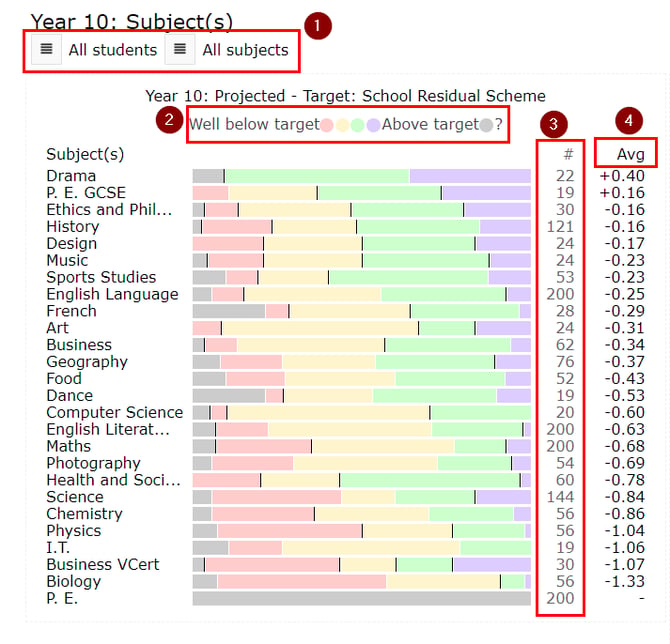 The default will display your residual ribbons based on your preferred target and progress grades.
- Filtering options for students and all subjects.
- The ribbons will display your default residual scheme, any subject specific residuals will display separately.
- Count of students in each subject.
- Average residual difference comparing target to progress based on the residual scheme. In this view subjects are ordered by descending residual values.
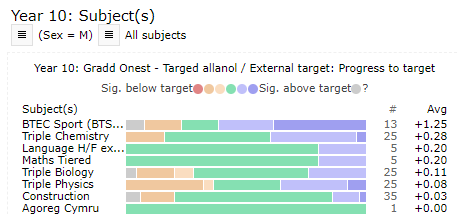
 The ribbons are fully interactive, and each section can be hovered over to view tool tips for each individual ribbon band: here showing the number of student in each band and cumulatively. This allows for a quick comparisons to be made.
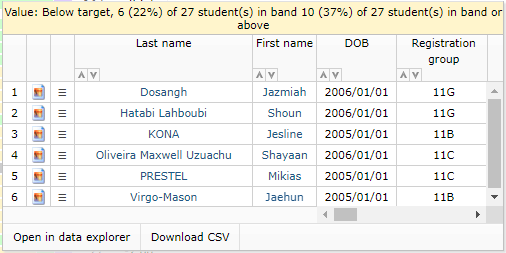 Clicking on a section of the ribbon shows a pop up listing the students in the band with the key details. From here these students can be downloaded as a .csv, opened in a data explorer to add in additional data or clicked on an individual student to go to their student page.
Adding ribbons
You can add additional residual or distribution ribbons to the default set and select your preferred display by using the ribbon menu bar:

When adding ribbons this will add an additional column to the default set.
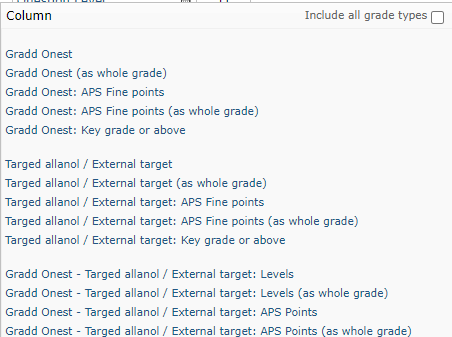
You can select from each enabled grade type and different progress grade and target grade comparisons using the school residual schemes applied. Your main target and progress grade will be prioritised in the list, but by selecting ‘Include all grade types’, additional grade sets will be added to the selection.
For each grade a range of options is available for fine or whole grades and various points options (APS, school score, etc). The ribbons will be ordered highest to lowest based on the value selected.
It is important to think about the format of the data when selecting the ribbons’ values, as some selections will show a huge range of values that will be difficult to review e.g., current grade APS points will find individual points values per student for each subject. You may wish to consider using the csv download when using such a wide spread of values in the data.
Once you have selected the additional ribbons you can use the menu to change the display layout.
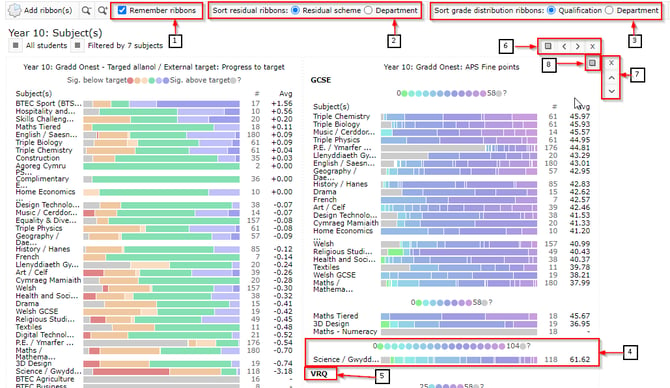
- Remember ribbons allows the user to retain their selection of ribbons on their device using cookies. These will be removed if the cookies are cleared.
- The default residual ribbons display based on residual schemes is in use, this can be changed to display the ribbons grouped by department.
- The grade distribution ribbons will by default display based on qualification types in use, the example is showing all GCSE qualifications as a group of ribbons. This can also be changed to view subjects by department.
- The GCSE combined science is split from the main set of ribbons due to the double grade scheme in use.
- Other qualifications in use will be shown separately in the display i.e. VRQs and School schemes as shown.
- The display allows the ribbon columns to be reordered left to right or removed.
- The side display menu will move the ribbon rows up or down.
- The
 icon will display the table view.
These display options become very useful when viewing the data as tables.
Viewing data tables
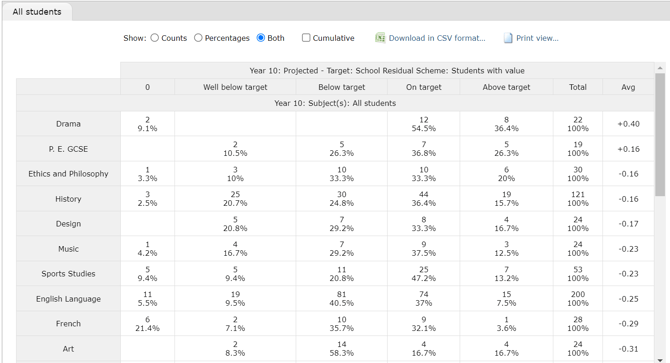 For each ribbon set or column view the
  icon can be used to view the data in a table format.
The table data remains in the same order as the data in the ribbon view. The data remains interactive, and each cell can be clicked on to view the names of the students.
The table has options to view counts, percentages or both as a distribution or as cumulative data.
The data in the table can be downloaded or printed from your browser.
When set to department the ribbons and tables will display the data accordingly. This may be a preferred option when reviewing the data with subject leaders or using one of the outputs.
Filtering ribbons
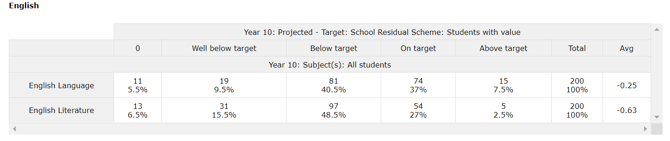
You can use the filters on each row of ribbons to filter the data
Filters by subject
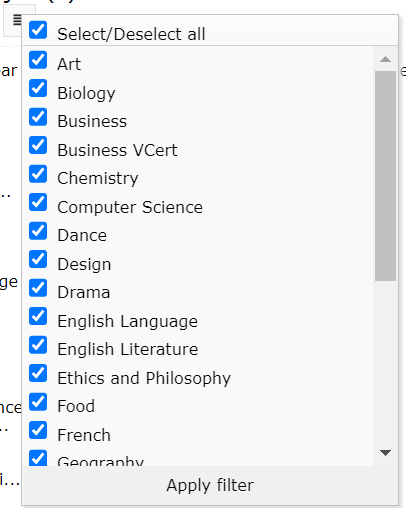 It is important that you use the subject filter to remove any subjects that are non-curriculum so a comparison can be made of subject performance in the taught curriculum. The filter will remove these subjects. By default, all subjects will display the residual ribbons based on your school residual schemes. If different residual schemes are applied to subjects, they will be split out of the table, so you are comparing like for like.
Click on the subject menu filter at the top of the enhanced ribbons and deselect the subjects you wish to remove from the ribbons view.
Filter by student
When selecting the student filter, you can define a set of students or select from the list of attributes used for analysis. Filtering will add a new row of ribbons to your selection.
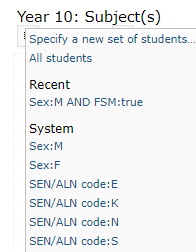
Specifying a new set of students will bring up a pop-up to allow multiple filters to be applied to the ribbons. For each focus group you will need to select the group to include in the filter as below:
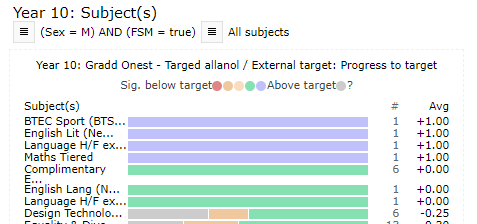
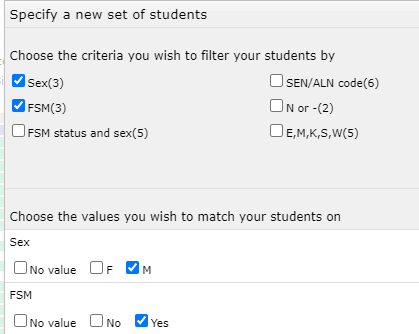
The ribbons will display the selected filter and each time a filter is applied this will add a new set of ribbons as a new row display.
The data tables will display in the same order as the ribbons.
Note, when ad ding a row of additional filters, the table view will become a long scrollable list so consider the key groups views you require and work with these sets of data using the interactive tools to maximise the benefit of using the year group ribbons.
Analysis of subject data over time (Curriculum overview)
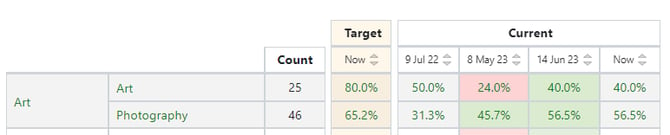 Guidance on carrying out analysis of subject data over time can be found here.
Relative performance indicator analysis
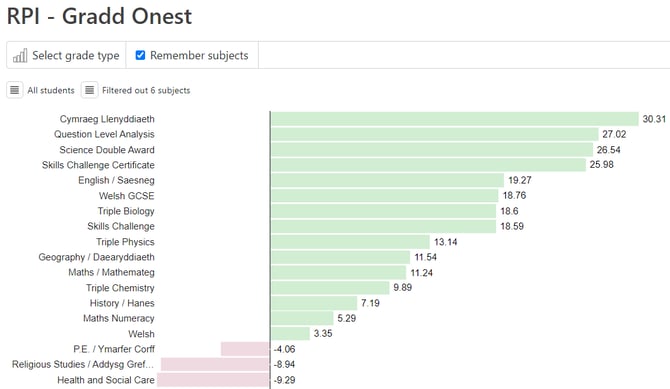 Guidance on carrying out comparative analysis based on their cohorts can be found here.
Useful links and Supplementary Guidance
- Interim Key Stage 4 School Performance Arrangements: Measures and Analyses
- Education Endowment Foundation – Teaching and Learning Toolkit
- Education Endowment Foundation – Practical Tools
- Estyn Guidance: What we inspect
- Estyn Guidance: How we inspect
- Education in Wales: Our national mission
- QiW (Qualifications in Wales)
- Successful Futures