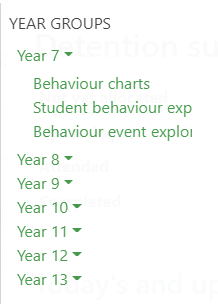
If enabled, Behaviour charts are available via a link at the top of the year or subject group pages. They are also available under the Behaviour menu:
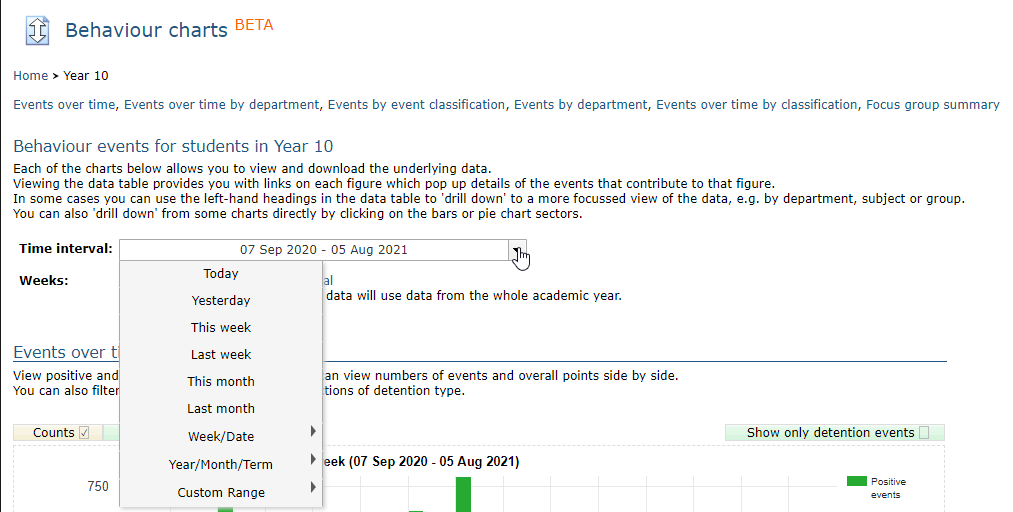
The behaviour charts page can have a pre-determined or custom date range set at the top. This allows schools to measure changes in behaviour patters over user defined periods of time. Charts can show the behaviour analysis of year groups and subjects, broken down by the focus groups as defined in student attributes.
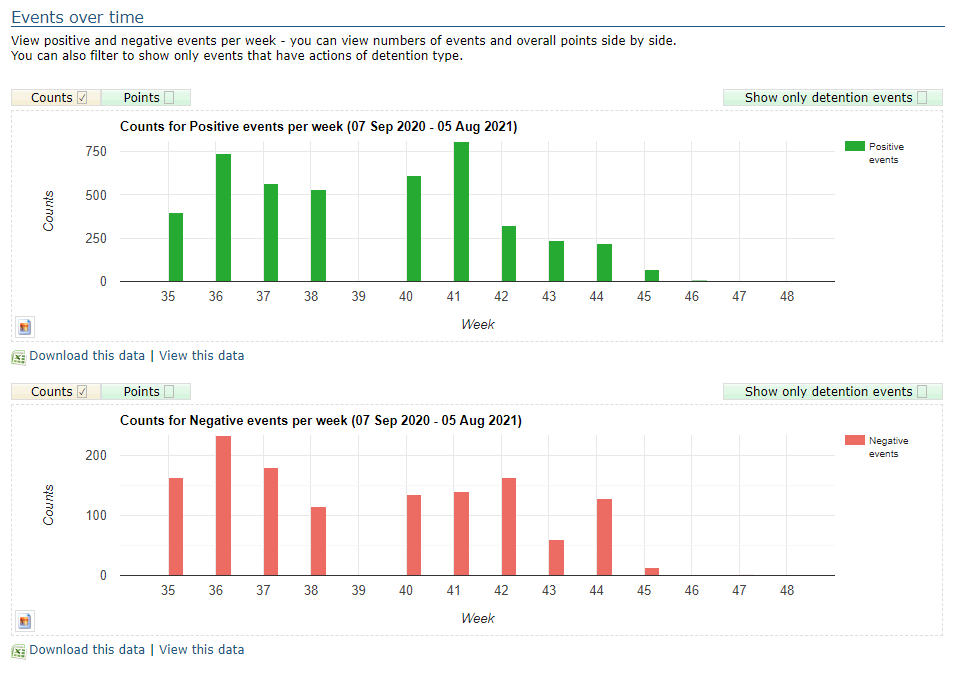
Events over time can help a school to identify key weeks in the school year:
 The events by event classification charts can be changed between pie charts and bar charts, as well as between event counts and event points: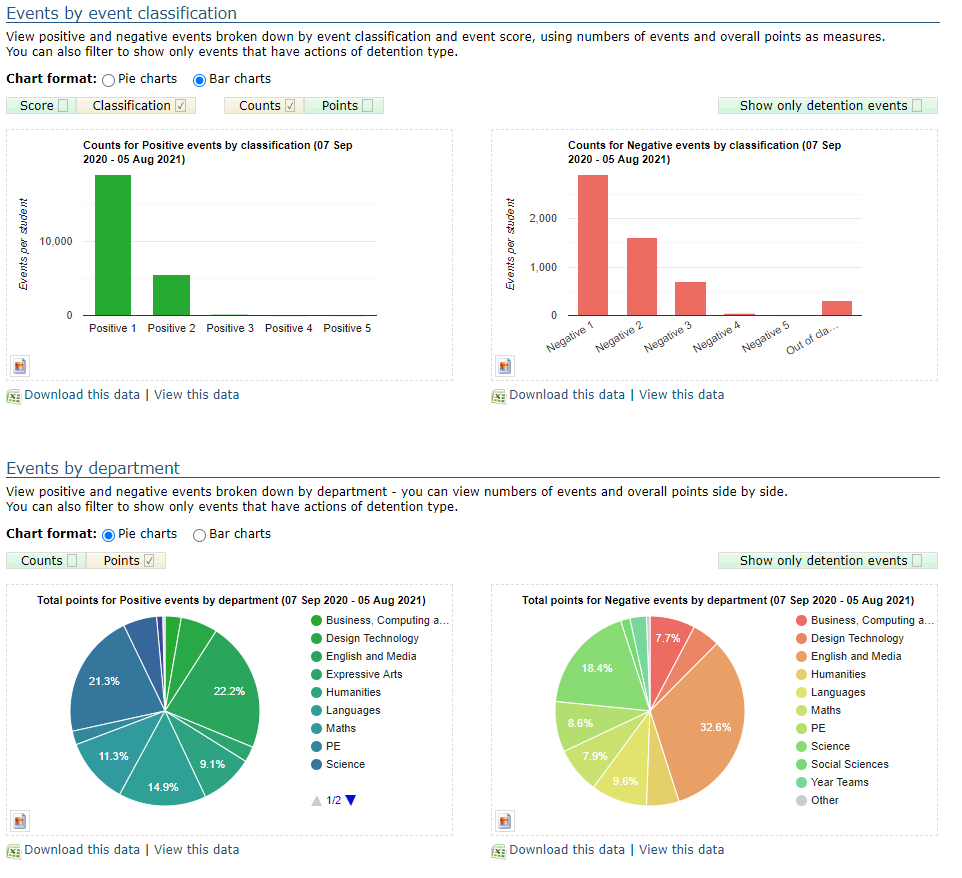
By hovering over the Events by department charts, the subject will be identified. Double-clicking on the segment will take you to that department's behaviour charts.
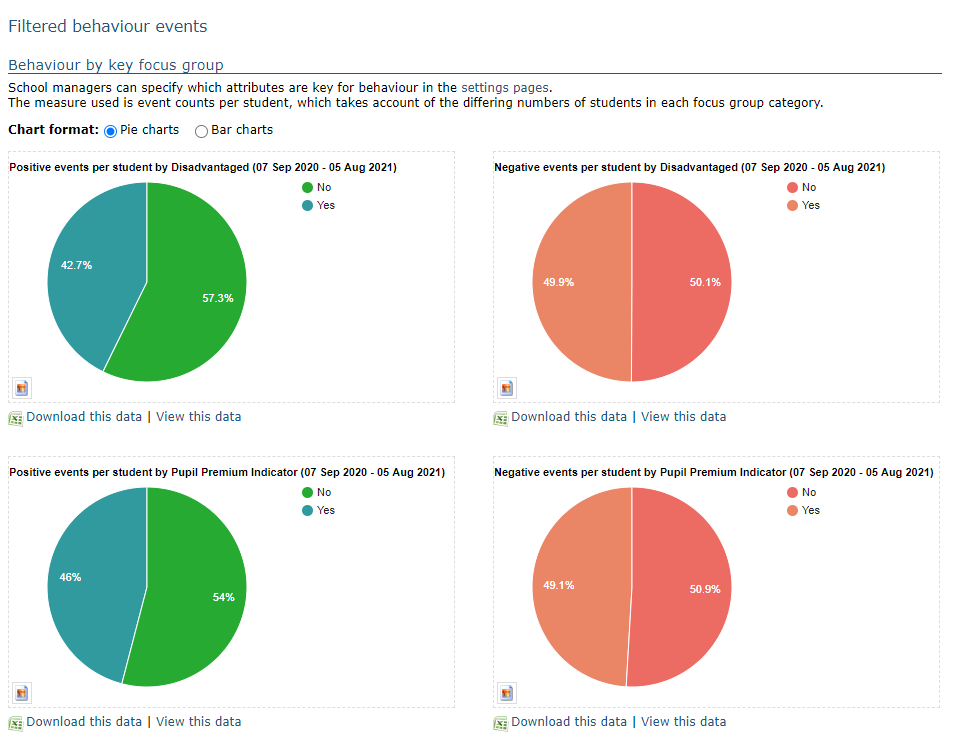
Focus group behaviour charts
At the bottom of the behaviour charts page there are charts for any groups that have been flagged by school managers to be used for the analysis of behaviour.