GL Education provides the Progress Test (PT) series data to supports schools (and the inspectorates) in monitoring academic achievement over the course of an academic year.
Once results are received this data can be bulk uploaded to GO 4 Schools and output in several ways:
- Uploaded to student attributes and added to a set so staff can access this data via a markbook pop-out or on the student page.
- Create subjects (via feed rules) for each test (maths, English and science), this would enable the following:
- Adding to a take home report
- Analysis by year group
- Can do further feed rules to create a single subject for phase analysis.
You could do any/all these recommendations based on your preferences and the modules you use.
Bulk uploading attributes
Once the results are released you can create and/or populate multiple attributes by uploading a single CSV file rather than having to define and populate them individually. This provides a more efficient way of uploading attribute data. GO 4 Schools can read attribute data from CSV files that adhere to the following formatting conventions. The file must:
- Have a header row as the first row which provides default names for the data columns in the file.
- Have the same number of values in each row.
- Contain one or more data columns to allow GO 4 Schools to uniquely identify students. There are two options for identifying students: a single UPN value, or alternatively the surname, firstname, date of birth, and sex of the student.
Preparing your file for upload
The file can contain as many rows and columns as you want (e.g., several year groups in a single file), but the more data it contains the slower it will be to process. If the file contains a lot of columns that you do not want to import, we recommend removing them from the file before uploading it. You can indicate that columns are not to be processed after importing but removing them before is more efficient.
For example:
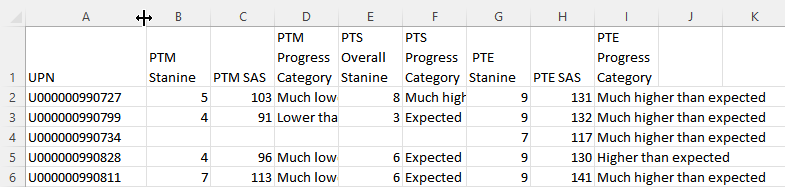
All student identification values in a record are optional, but whatever values are provided will be used to try to identify a unique student for that record. If a unique student cannot be identified, the record will be rejected.
If multiple records for a student can be found in a file all those records will be rejected.
Validation
As well as checking the student’s details, GO 4 Schools uses the following rules when interpreting the contents of a CSV file:
- Records that do not match one of the formats above are rejected. This includes blank lines.
- Dates (whether dates of birth or values to be held for attributes) can be provided in a wide range of formats, but the recommended format is dd/mm/yyyy e.g., 01/09/2022. (A date such as '12/02/2022' will be interpreted using a UK format as 12th Feb, rather than 2nd December.)
- Sex can be provided as M, F, m, f (i.e., it is not case sensitive.)
The upload process
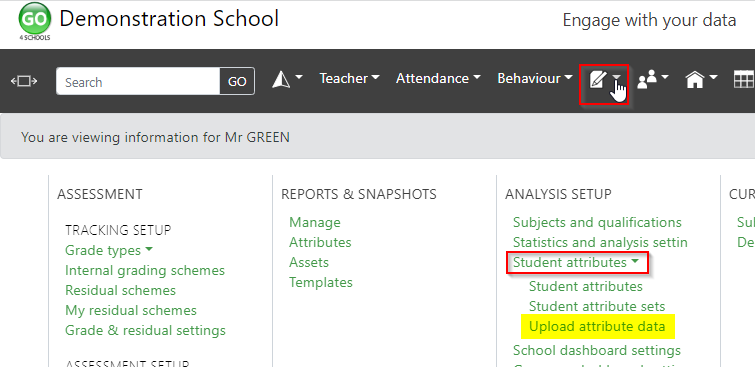
The link to bulk upload is in the Curriculum menu:
Browse to the file you wish to upload and click on the Upload button:
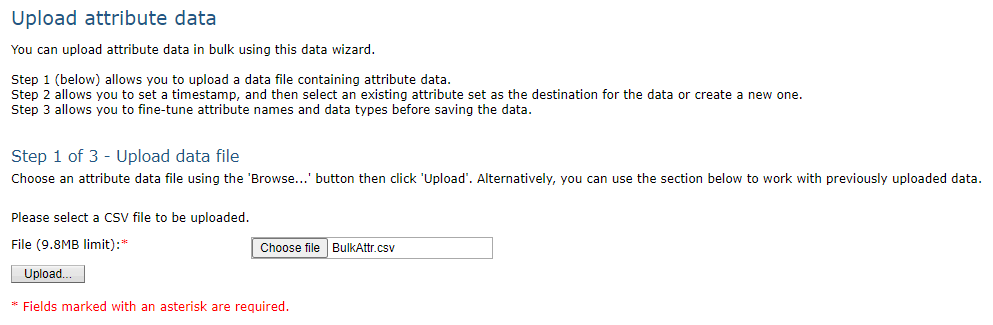
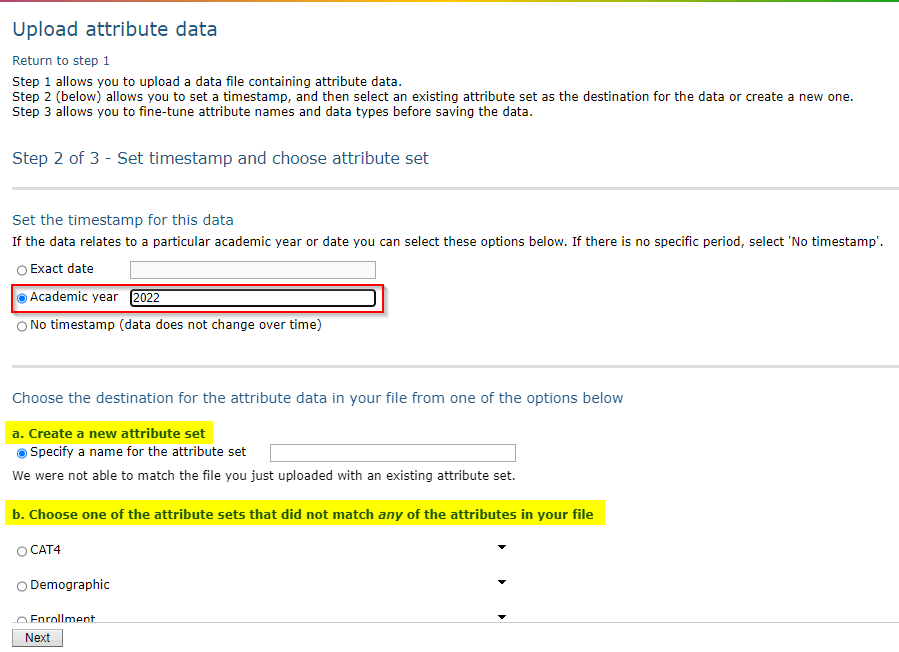
On the next page you are first given the option to set a timestamp for data you wish to upload, and you will want to timestamp it with the academic year the result was achieved. Next you are given options on which attribute set you want to upload the data to. The options presented will depend on the names of the columns in your file. The list of options are:
- Create a new attribute set - If you want to create a new attribute set (this would apply if this is the first time you are uploading PT data).
- Add the data in your file to the best guess attribute set (this would apply if you have a pre-existing attribute set in place).
- Add the data in your file to an existing attribute set that partially matches the columns in your file.
- Add the data in your file to any other existing attribute set.
Please note, once the data has been uploaded it is then possible to move the attributes in to different sets, e.g., if you have a different set for PTE, PTM and PTS.
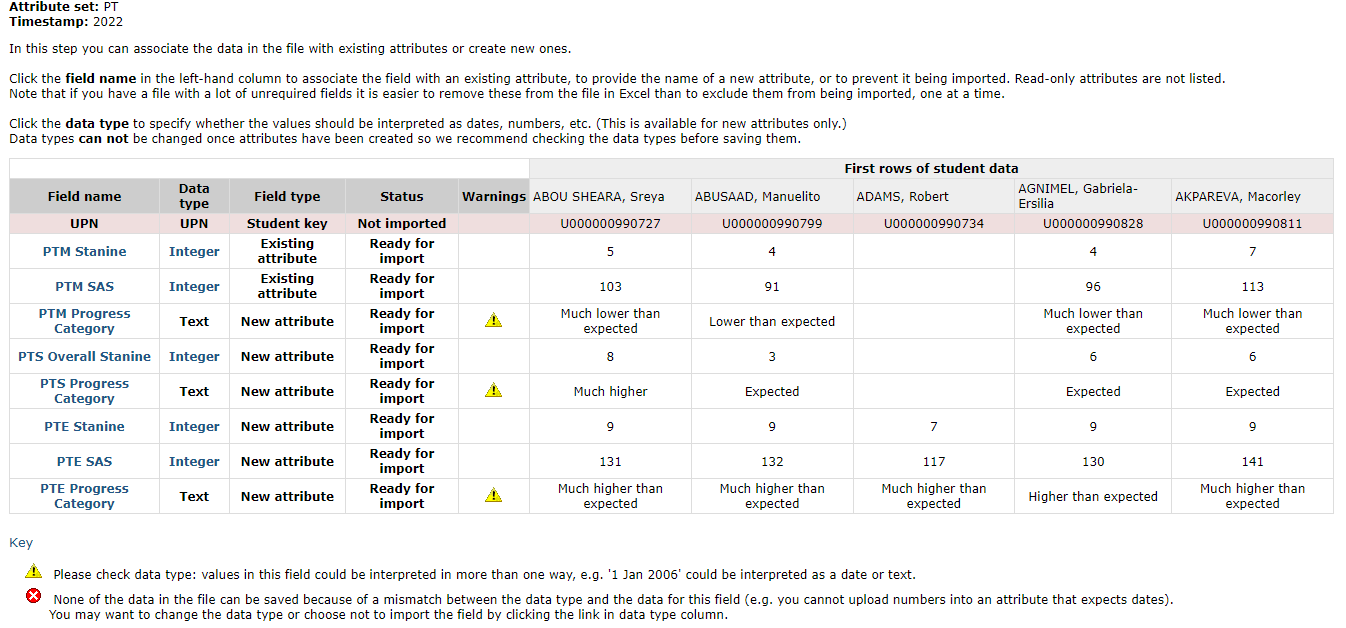
As it is possible to upload multiple attribute values in a single file, the final step gives you the opportunity to review and refine the data prior to uploading. Each row in the table displays information about a specific column/field in the file. The summary table shows the following information based on the data in the file:
- Field name - The name of the field in the file.
- Data type - The type of value in the file, such as text, Boolean, date, etc. At this stage this is just a best guess from GO 4 Schools.
- Field type - Whether the field is recognised as a student identifier, and existing attribute, or a new attribute. Student identifier columns are highlighted in pink. The data in these columns is not imported as it is simply used for identifying the student to which the values belong.
- Status - Whether the field will be imported.
- Warnings - If potential discrepancies are detected within the file a warning icon will be displayed.
- First rows of student data - Show the first few rows of data within the file for information.
In the below screenshot several fields have been recognised as existing attributes, such as PTM stanine and PTM SAS. The others are not recognised as existing attributes in the PT attribute set, so you are given the choice to create these attributes.
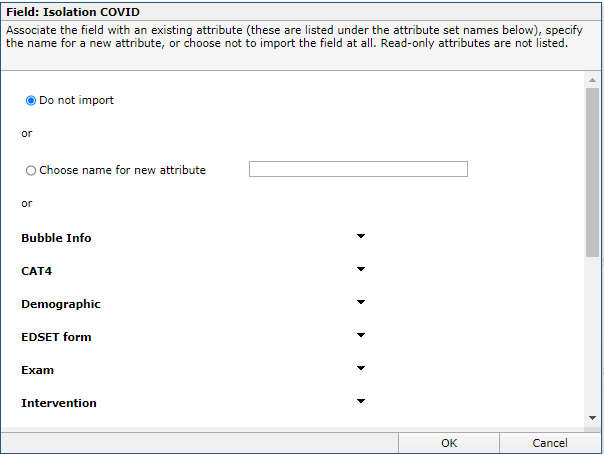
Clicking on a field name will open up a new window which will give you the option to either create a new attribute or choose not to import the data at all. It is also possible to click on a specific data type for a field and change the data type (for new attributes only). Please note that once an attribute has been created, it is not possible to change the data type. If the file contains data for unrecognised students, details are shown in a separate table. Once you've made all your edits/adjustments, click on the Finish button at the bottom of the page to upload the data.
Assigning visibility of the attribute set in a markbook pop-out
Once your data has been uploaded you can then adjust/rename the attribute set they have been added to via Curriculum > Student attributes > Student attribute sets.
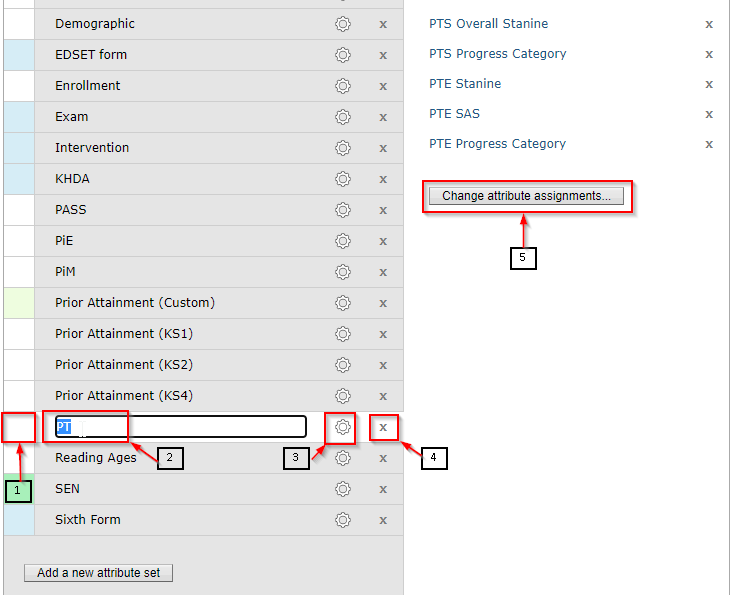
- You can assign a colour to the set which will be visible in the markbooks and explorer headings.
- You can change the name of the set.
- Set the visibility, by year group, for the attribute set in markbooks (note, it will not display in subjects if there is no data uploaded for that cohort of students).
- Delete the set.
- Change the attributes present in the set.
The attribute will then be visible to all staff in their markbooks:
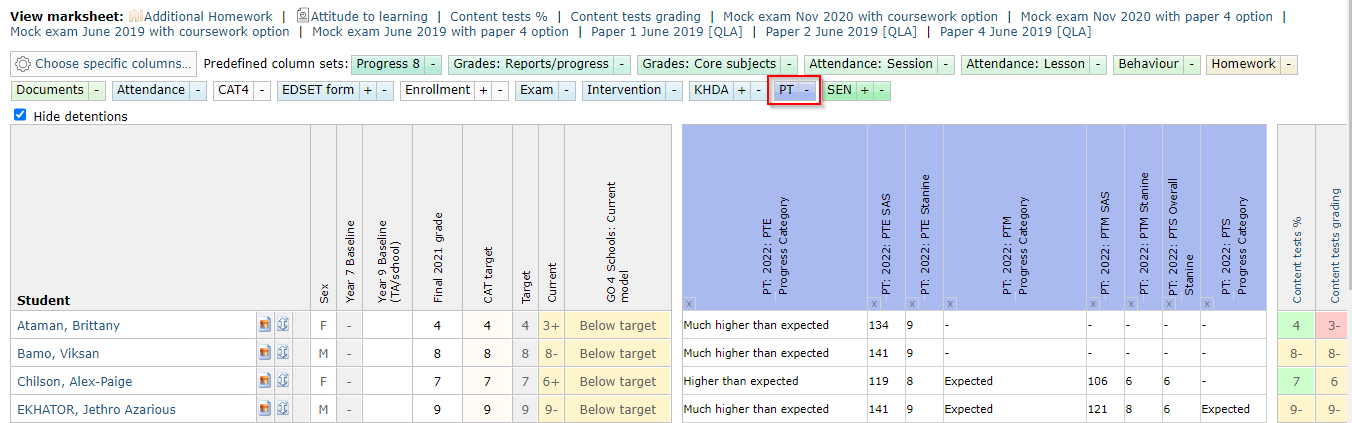
They will be available in the explorers:
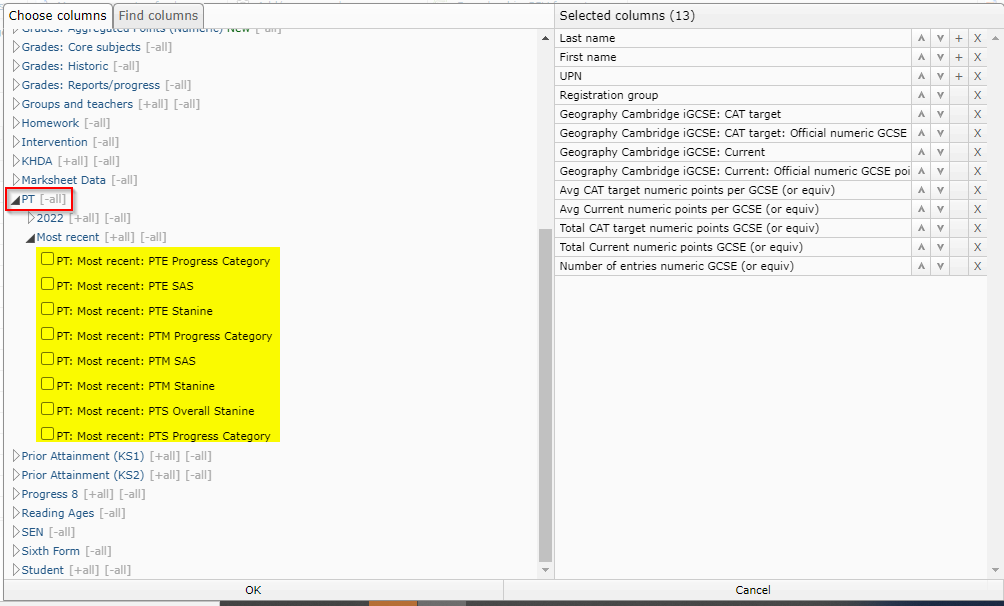
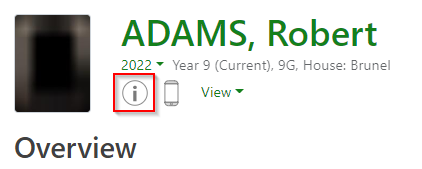
And on the student page by selected ‘View profile’ from the information link:
Adding to seating plans
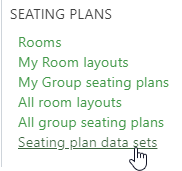
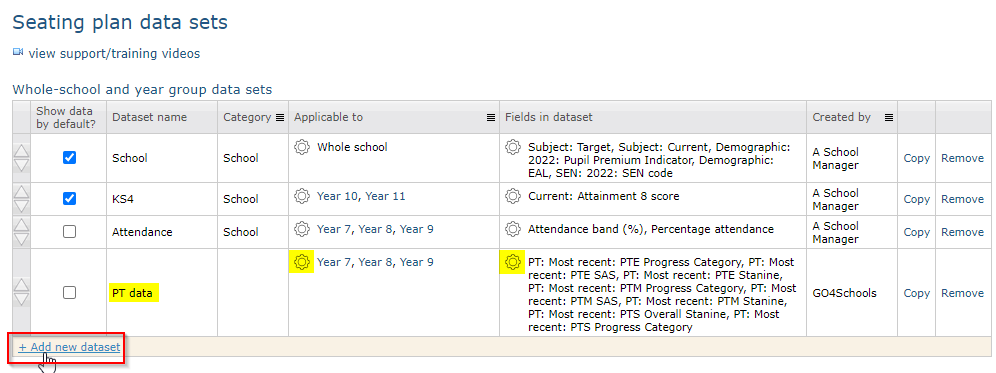
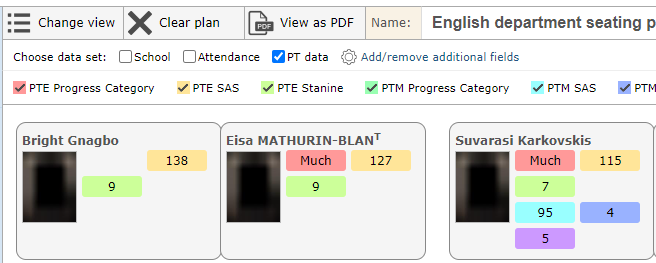
From Teacher > Seating plan data sets you can add these fields to a pre-existing, or custom data set, applied to the appropriate year groups:
Creating subjects to hold PT data
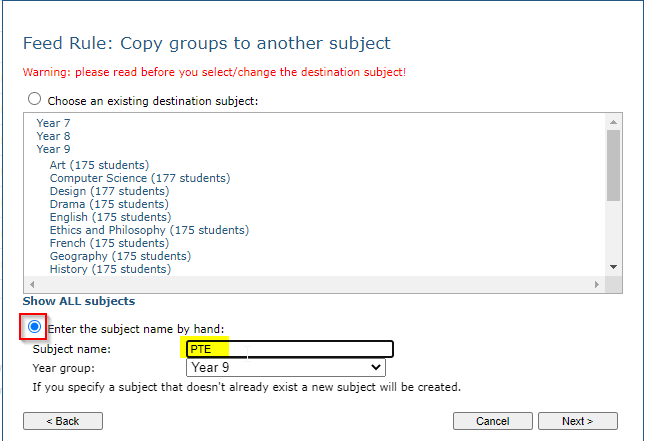
You can create subjects for each of the progress tests via Manage > View feed rules (if you have school manager access). You may wish to ‘copy’ a subject that contains the whole year group cohort, e.g., registration.
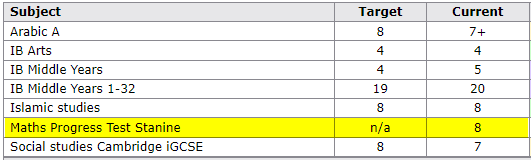
When you are entering the subject name by hand remember this will also be the name of the subject that appears on the reports to parents (should you decide to add them to reports):
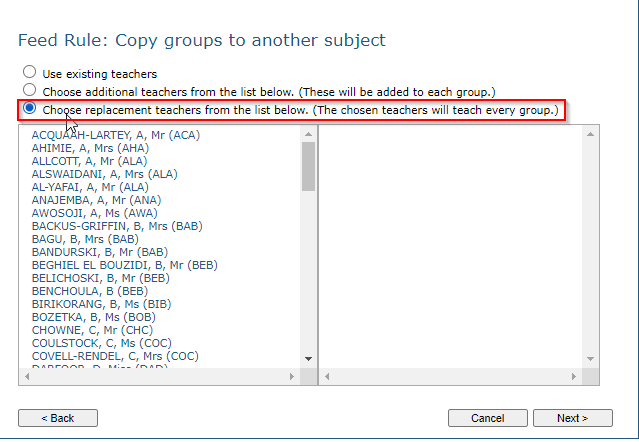
If you do not wish to have the tutors (or any other members of staff) assigned to this subject, select ‘Choose replacement teachers from the list below’, but don’t select a name and just click ‘next’.
Please note, feed rules take over night to be actioned, but the following morning the subjects will be available to move to a department, assign a qualification and marksheet and upload data to.
Assigning a qualification and adding marksheets
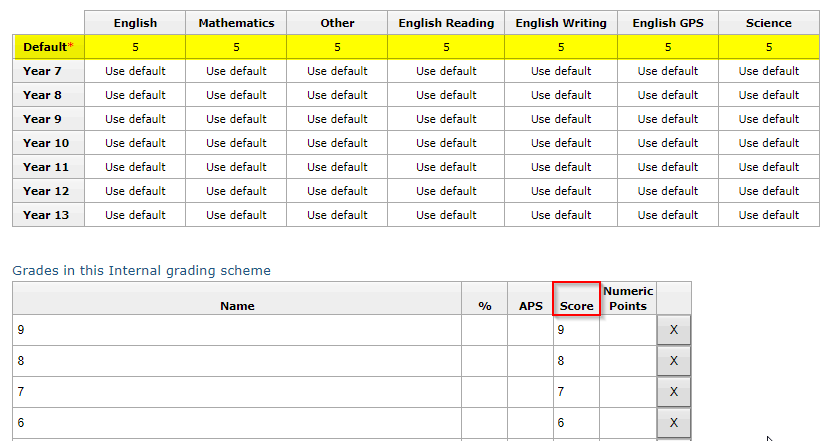
You will need to create an Internal Grading scheme (IGS) for assigning to the new subject, whether this is for the progress statements or stanines. To create a scheme, navigate to Curriculum > Internal grading schemes > Create a new internal grading scheme and from this page you could create a 9-1 scheme for assigning to the PT subjects. You may wish to set the key grade as 5 across all the fields, and add a value to the ‘Score’ column to provide additional statistical outputs:
Visibility on a take home report
Using interactive ribbons to analyse the data
The interactive ribbons can be found on the subject page (or a group page) below the ‘at a glance’ ribbons.
These ribbons allow you to view the data in two different ways:
- Subject results as a whole cohort or broken down by each of the sub-groups
- Results broken down by teaching groups for one of the sub-groups at a time
By clicking the ‘Add ribbons’ link (found above the new ribbons) you will be able to access a window where you can select your focus group and the column, as shown in the images below:
By selecting the ‘Sex’ row and the column displaying ‘key grade or above’ you will have a breakdown by percentage of each sub-group on a 5 and above.
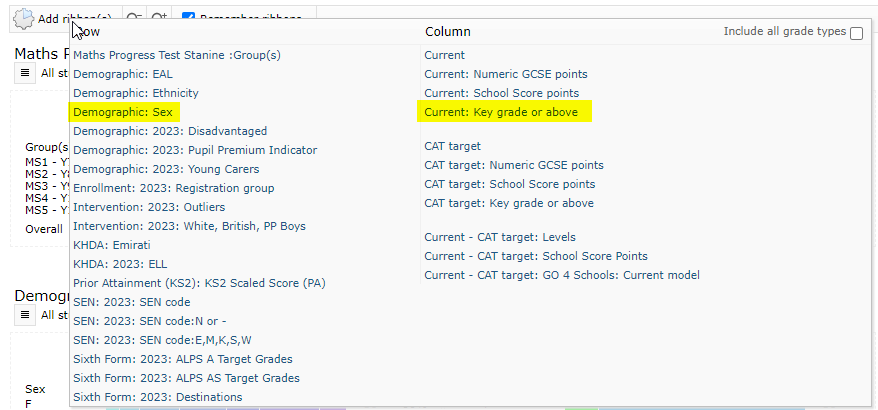
A new row of ribbons will then appear displaying your selections (you may need to scroll right to view the ‘key grade or above’ ribbon as it will appear at end of the three default ribbons). In the example below the first default set of ribbons has been hidden:
By clicking the hashed box in the top right-hand corner of the ribbon you will be able to access an enlarged image of that ribbon and the data sitting behind it:
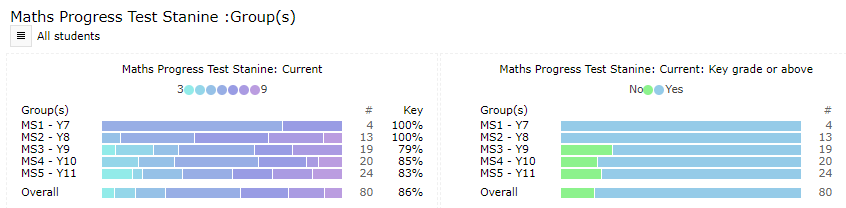
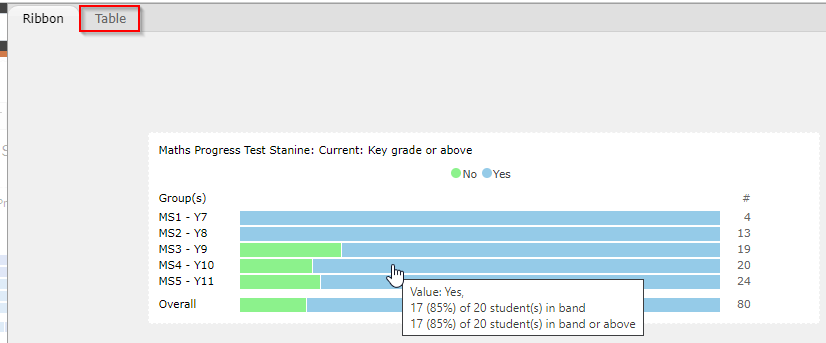
Hovering over a ribbon’s section will display a tool tip providing the number of students contributing to that element.
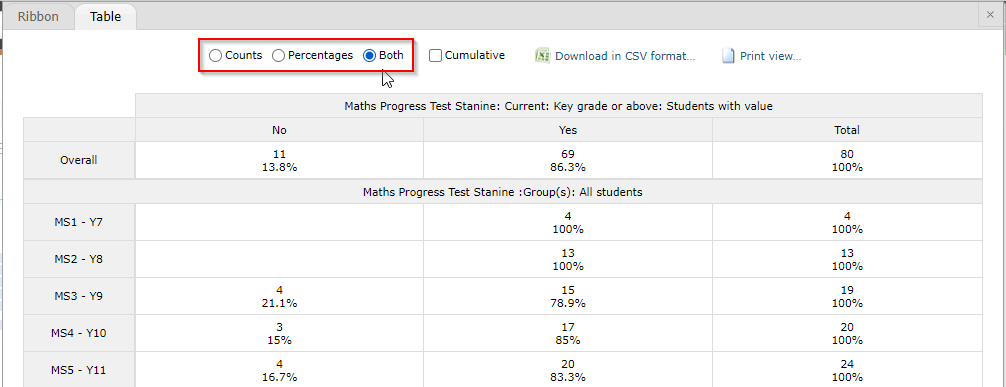
Clicking on the table tab will take you to a page displaying the ribbons data in table form.
You can select whether you wish to view the data as counts, percentages, or both as a distribution or cumulative.
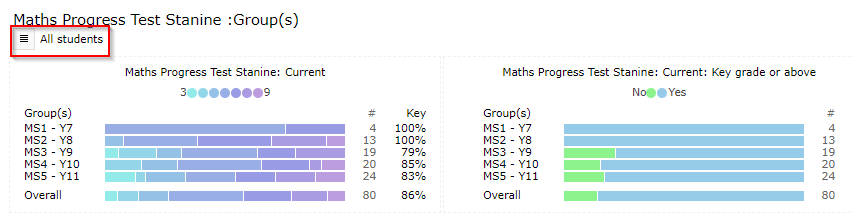
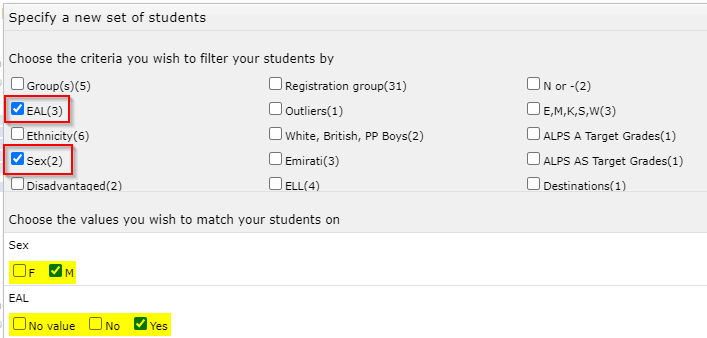
By clicking the ‘Add students’ hamburger you will be able to select your sub-groups as a filter. Please note you cannot select them all at the same time, you will need to do them individually to produce a set of ribbons for each of the sub-groups.
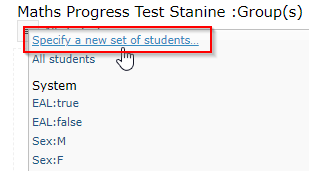
Tick the box of the sub-group(s) you would like to view first:
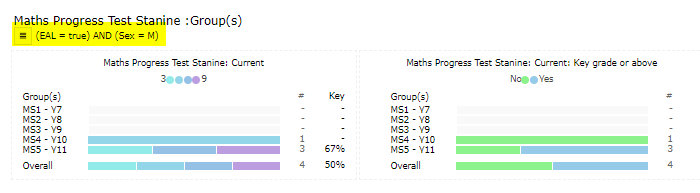
The ribbons below are showing a breakdown of subject groups filtered by EAL boys:
Group page
The same analysis (chart and ribbons) is available at a group level by following the same steps as above.
Multiple subject analysis
The same analysis (ribbons) is available at a year level by following the same steps as above on the curriculum analysis page.
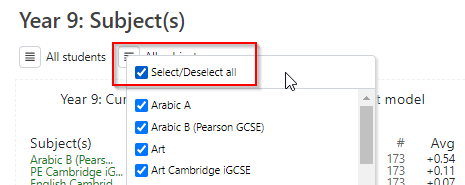
Use the subject filter to select the PT subjects before carrying out the filtering process: