Skip to content
English - United Kingdom
  • There are no suggestions because the search field is empty.

Questions to Consider During Subject Results Analysis

Examples shown are for KS4 but the same approach can be used for any key stage.

  1. What are the strongest and weakest performing subject areas?  

GO TO: Year group > Ribbons > Residual: current vs target – filter by key curriculum subjects. 

The ribbons default will display the subject by descending residual values.


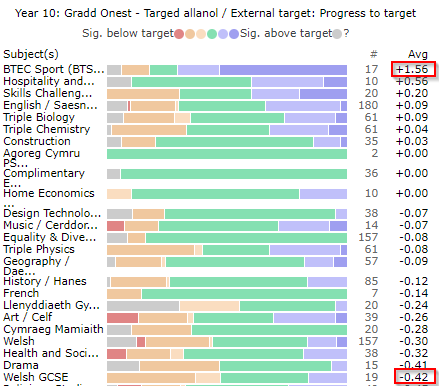
  1. This can be viewed as the greatest and lowest residual when comparing actual grades to target.  In the example BTEC Sport +1.56 is the strongest and Welsh GCSE -0.42 is the weakest as almost half a grade lower per student lower.
  2. Reviewing the residual order shows many subjects are below target as showing a negative residual.
  3. Also, the number of students well below target, shown by the red lines, shows 13% of students were well below target in music.

Enhanced ribbons – residual:

View the tooltip or the table view to see the numbers within the ribbons.

  1. What are Subjects contributing to the headline measures?

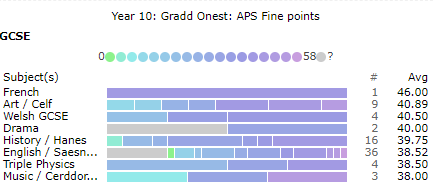
GO TO: Year group > Ribbons > Add ribbons > Grade: APS GCSE points. 

The ribbons default will display the subjects by descending average APS points.


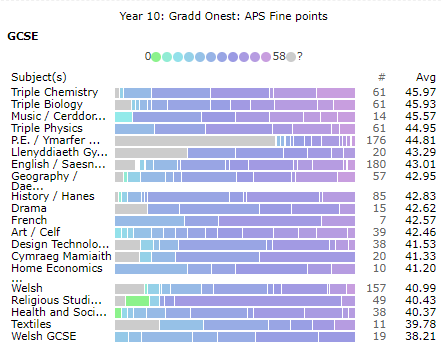
  1. Chemistry, Biology and Music all contributed over 45 APS points on average to school performance measures.
  2. Compare to target numeric points and these subjects also had the highest target points values, so potentially a higher attaining cohort of students.

Enhance ribbons – APS points:

  1. What is the performance at grade C+, A+ across subjects?

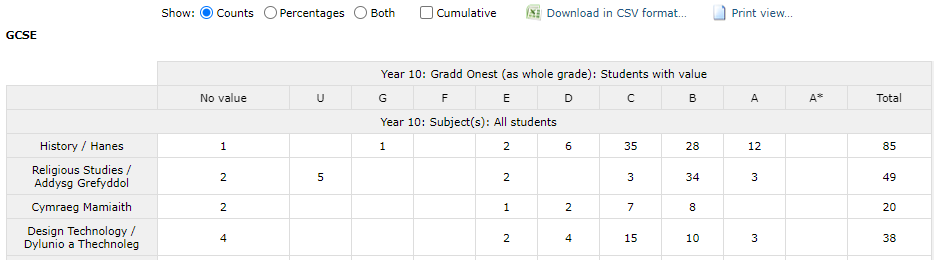
GO TO: Year group > Ribbons > Add ribbons > Grade (whole grade).

The ribbons will default to display in descending order by percentage of students achieving grade 5+.  
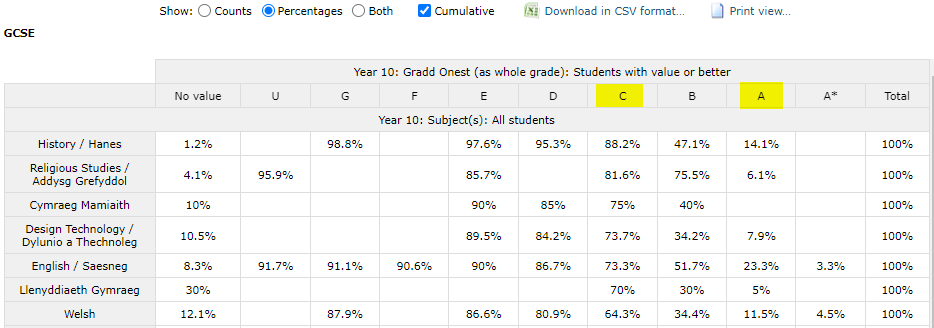
GO TO:            to select pop-out view > Table tab > Show: Both (counts & percentages) + cumulative. 


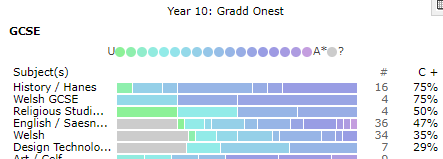
  1. Using cumulative view review percentage of students at grade C+ and A+ (use counts to check numbers for small cohorts of students.
  2. In the example History has 88% at C+ but English has 23% at A+.
  3. These are both higher than Drama, but the ability range of the students has to be considered in the subjects.


Enhanced ribbons – grade distribution (whole grade).

  1. How have FSM students performed across the curriculum?

GO TO: Year group > Ribbons > filter by FSM = Yes. 

              GO TO: Add ribbons > Grade (whole grade) 

              GO TO: Add ribbons > Grade : APS

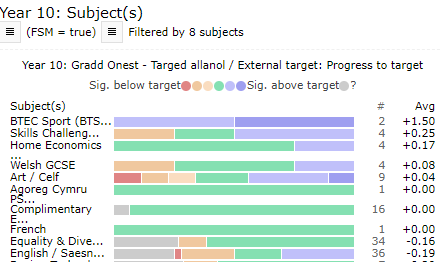
  1. The subject order in the residual ribbons differs for FSM students but check the student count as Agored only has 1 FSM student.
  2. Review the ribbon colouring, where the larger red ribbons display indicates subjects where FSM student have not performed and are below target.
  3. Whole grade distribution will show the percentage at grade C+.
  4. Using APS points check the subjects’ average APS contribution.

Enhance ribbons – residual > filter by FSM


Ribbons > Whole grade distribution:


Ribbons > APS points

  1. What does the total grade distribution look like across all subjects? 

GO TO: Year group > Ribbons > Grade (whole) – filter by key curriculum subjects for a count of grades for all exam subjects.   

View table view > select counts > download CSV

  1. Calculate the totals for each grade. 


  1. Divide the total for each grade by the total student count and format as a percentage. 
  2. Hide the rows for each subject to display a table showing the percentage of all grades for the year group across your curriculum.     This is useful to compare to target, current, projections and actual grades to see differences in where the students are.  This data can also be compared to the JCQ national data. 


Curriculum design and delivery for the future

  • What impact has your curriculum model had on subject performance?  
  • What refinements do you have planned to enhance your curriculum offer for future KS4 students?
  • Does your curriculum have both breadth and depth across the ability ranges of your students and does this reflect positively in student outcomes?