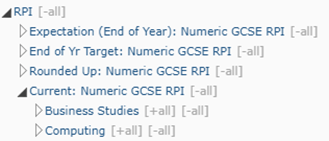
In GO 4 Schools the RPI will enabled schools to track by a subject the average student points compared to the average points achieved by the same group of students in all their other subjects across the academic year.
The RPI will use formal APS, fine points will not be used.
Important details to consider when using the RPI
Students with a missing grade in a subject are given a points value of ‘0’ but are included in the overall average count. The entry count is also based on the group membership of the subject. This can skew the overall subject RPI when comparing to other subjects; for example:
- 15 students study computer science and 10 have grade C (40 APS) and 5 have no grade. The average pts for this subject would be 26.67, a much lower average grade.
- Subjects with low numbers of students are also compared to subject with larger cohorts, so a second language subject may only have 3 students but is compared to English with possibly over 200 students.
- The RPI will only display subjects using QANs with formal points and a discount code.
- The RPI will honour the subject ‘exclude from stats’ setting in subjects and qualifications.
- The inclusion of actual grades will not be applied to any grade type.
- The RPI includes all students with a subject group membership but will NOT include students from other year groups, this includes guest students and dual reg students.
Handling combined science
Combined Science (Wales) is 2 subject entry and uses the APS i.e. BC = 46 and 40 APS.
Calculation and worked example.
Student A has the following GCSE grade points:
|
Entry |
Subject |
Points |
|
1 |
English language |
40 |
|
1 |
English literature |
46 |
|
1 |
Maths |
46 |
|
1 |
Chemistry |
46 |
|
1 |
Biology |
52 |
|
1 |
Physics |
40 |
|
1 |
French |
46 |
|
1 |
Geography |
40 |
|
1 |
PE |
52 |
|
1 |
Business |
40 |
|
10 |
Total |
448 |
Student A Maths residual:
- Student A Maths APS = 46
- Student A (Total points all subject - Maths points)/total entries less Maths (448 - 46 = 402)/ (10-1 = 9) = 44.67
- Student A Maths subject residual = Maths points - Avg residual points (46 - 44.67) = +1.33
Group residual Maths:
Sum of all students in Maths individual Maths subject residual / count of all students in Maths: i.e.
- Student A Maths residual +1.33
- Student B maths residual -0.5
- Student C maths residual +0.2
- Total (1.03)/3 Avg = 0.34
Sum of all students in Maths group subject residual / count of all students in Maths group i.e.
- Student A Maths residual -1.6
- Student B maths residual -0.5
- Student C maths residual +0.2
- Total (-1.9)/3 Avg = -0.63
Maths residual
Average all Maths students individual Maths residual for Subject overall residual.
Enabling RPI
In the Statistics and analysis settings go to the visibility of statistics and the table includes a setting for the RPI. Rules can be applied to specific year groups, but this only needs to be used if formal qualifications are used across the year group.

At a glance page
The RPI chart displays on the year group at a glance page to enable a quick review of subject performance using the main progress grade. When viewing the chart subjects will be ordered from the highest overall residual to the lowest.
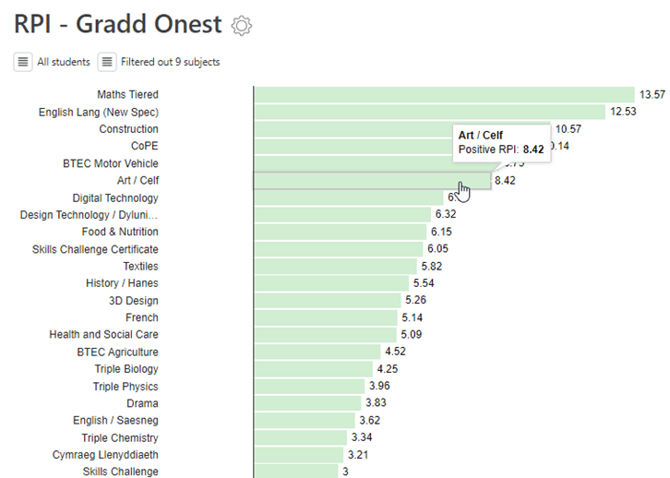
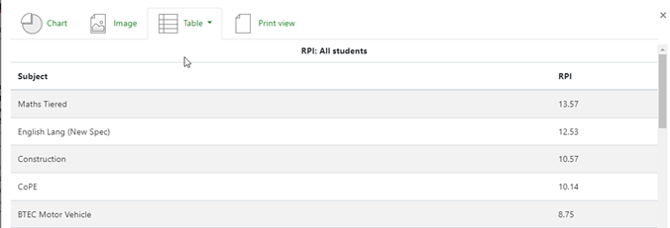
A tooltip will show the RPI for each specific subject and this can also be viewed by expanding the chart to see the data as an image, chart, table or csv download.
Curriculum analysis
The RPI can be viewed in more detail on the curriculum analysis page alongside the year group interactive ribbons. This view allows the subjects to be filtered and for the chart to be filtered by specific focus groups. You should also remove any subjects with missing data as this will skew the data.
 By using the cog, you can change the grade type view of the RPI. So, changing to view a target grade will allow the user to see the subjects with the highest targets compared to the targets in other subjects.
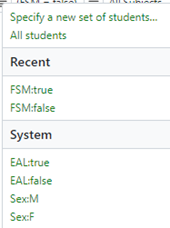 The student filter allows specific groups or multiple focus groups to be selected such as: HPA Boys and this will then redraw the chart view and recalculate the details in the table and csv downloads.
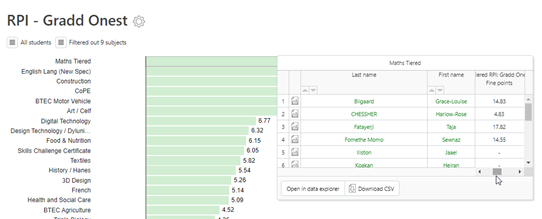
As well as viewing the tool tip with the subject RPI when you click on the bar a mini explorer will pop-up listing the students with subject membership and the individual student RPI for that subject. The mini explorer also displays the subject grade and link to a full year group explorer and provide a csv download.
Data explorer
The RPI is also selectable in the year group and subject explorer. It is listed in the year group explorer by grade type. In the subject explorer the specific subject RPI data for each grade type can be selected.